| Red | Green | Blue | |
| z | 17.64 | ||
| znorm | Inf | ||
| sky | -NaN | -NaN | -Inf |
| S/N | 25.6 | 44.4 | 47.6 |
| S/N(c) | 0.0 | 0.0 | 0.0 |
| SN(E/C) |
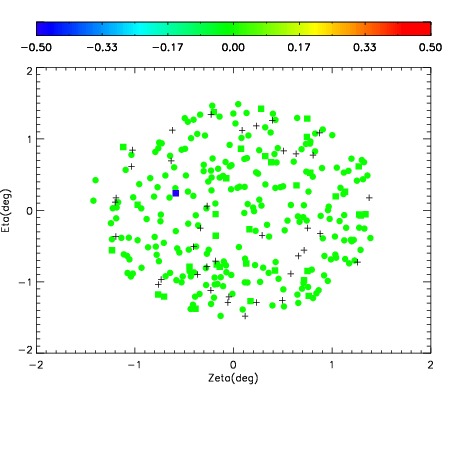
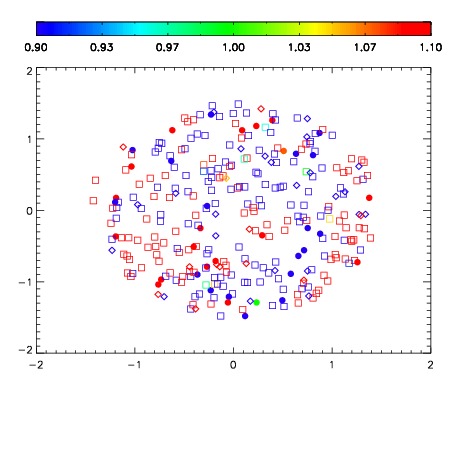


| Frame | Nreads | Zeropoints | Mag plots | Spatial mag deviation | Spatial sky 16325A emission deviations (filled: sky, open: star) | Spatial sky continuum emission | Spatial sky telluric CO2 absorption deviations (filled: H < 10) | |||||||||||||||||||||||
| 0 | 0 |
|
|
|
|
|
|
| IPAIR | NAME | SHIFT | NEWSHIFT | S/N | NAME | SHIFT | NEWSHIFT | S/N |
| 0 | 03980025 | 0.497233 | 0.00000 | 18.9652 | 03980030 | 0.00126372 | 0.495969 | 19.0174 |
| 1 | 03980028 | 0.495278 | 0.00195500 | 19.0785 | 03980026 | 0.00189180 | 0.495341 | 19.0354 |
| 2 | 03980029 | 0.494706 | 0.00252700 | 19.0186 | 03980027 | 0.00139979 | 0.495833 | 19.0214 |
| 3 | 03980024 | 0.496254 | 0.000979006 | 18.8957 | 03980023 | 0.00000 | 0.497233 | 18.9319 |