| Red | Green | Blue | |
| z | 17.64 | ||
| znorm | Inf | ||
| sky | -NaN | -NaN | -Inf |
| S/N | 32.5 | 55.4 | 59.1 |
| S/N(c) | 0.0 | 0.0 | 0.0 |
| SN(E/C) |
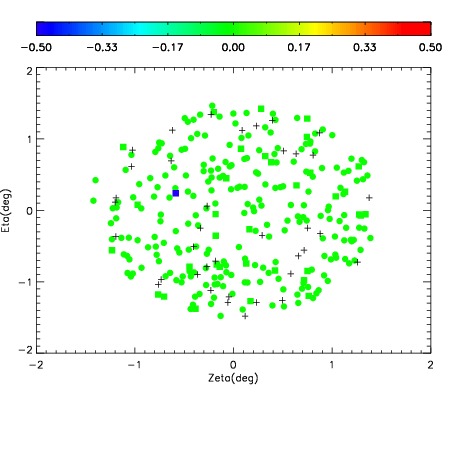


| Frame | Nreads | Zeropoints | Mag plots | Spatial mag deviation | Spatial sky 16325A emission deviations (filled: sky, open: star) | Spatial sky continuum emission | Spatial sky telluric CO2 absorption deviations (filled: H < 10) | |||||||||||||||||||||||
| 0 | 0 |
|
|
|
|
|
|
| IPAIR | NAME | SHIFT | NEWSHIFT | S/N | NAME | SHIFT | NEWSHIFT | S/N |
| 0 | 10230104 | 0.500175 | 0.00000 | 19.1329 | 10230103 | -0.00205649 | 0.502231 | 19.1156 |
| 1 | 10230097 | 0.498569 | 0.00160599 | 19.1911 | 10230098 | 0.00253583 | 0.497639 | 19.1749 |
| 2 | 10230100 | 0.499010 | 0.00116500 | 19.1853 | 10230099 | 0.00246191 | 0.497713 | 19.1695 |
| 3 | 10230096 | 0.498085 | 0.00209001 | 19.1611 | 10230095 | 0.00000 | 0.500175 | 19.1688 |
| 4 | 10230101 | 0.499934 | 0.000241011 | 19.1404 | 10230102 | -0.00187959 | 0.502055 | 19.1528 |