| Red | Green | Blue | |
| z | 17.64 | ||
| znorm | Inf | ||
| sky | -Inf | -NaN | -NaN |
| S/N | 26.8 | 42.9 | 43.9 |
| S/N(c) | 0.0 | 0.0 | 0.0 |
| SN(E/C) |
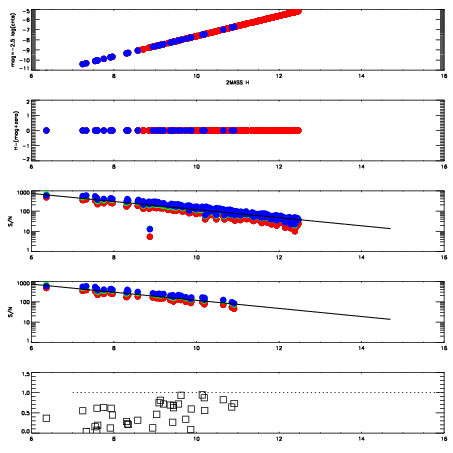
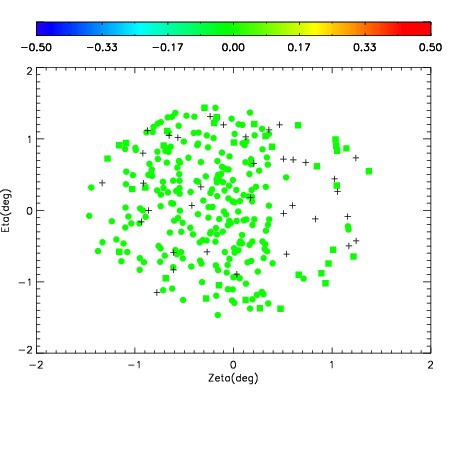
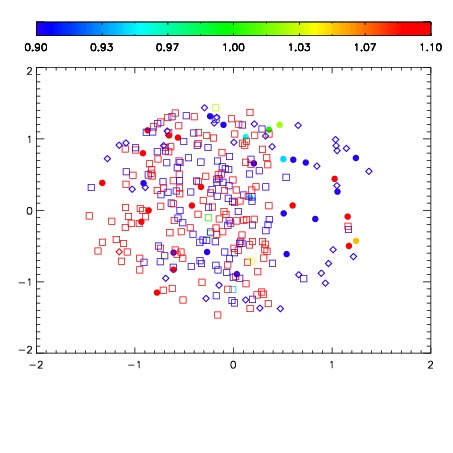
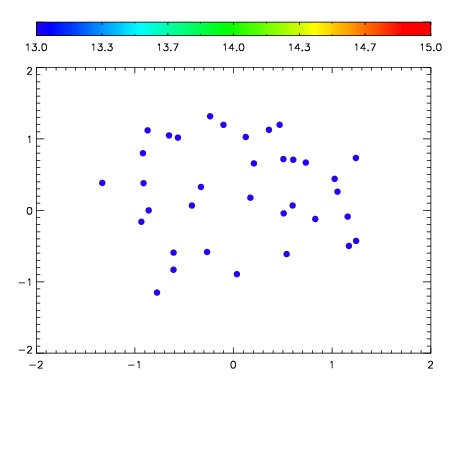

| Frame | Nreads | Zeropoints | Mag plots | Spatial mag deviation | Spatial sky 16325A emission deviations (filled: sky, open: star) | Spatial sky continuum emission | Spatial sky telluric CO2 absorption deviations (filled: H < 10) | |||||||||||||||||||||||
| 0 | 0 |
|
|
|
|
|
|
| IPAIR | NAME | SHIFT | NEWSHIFT | S/N | NAME | SHIFT | NEWSHIFT | S/N |
| 0 | 02850029 | 0.414041 | 0.00000 | 19.0614 | 02850030 | 0.000105796 | 0.413935 | 19.0472 |
| 1 | 02850024 | 0.409438 | 0.00460300 | 19.0939 | 02850026 | -0.000514914 | 0.414556 | 19.1075 |
| 2 | 02850025 | 0.410515 | 0.00352600 | 19.0704 | 02850023 | 0.00000 | 0.414041 | 19.0822 |
| 3 | 02850028 | 0.412646 | 0.00139502 | 19.0398 | 02850027 | -0.00159091 | 0.415632 | 19.0426 |