| Red | Green | Blue | |
| z | 17.64 | ||
| znorm | Inf | ||
| sky | -Inf | -Inf | -Inf |
| S/N | 24.3 | 41.4 | 42.9 |
| S/N(c) | 0.0 | 0.0 | 0.0 |
| SN(E/C) |
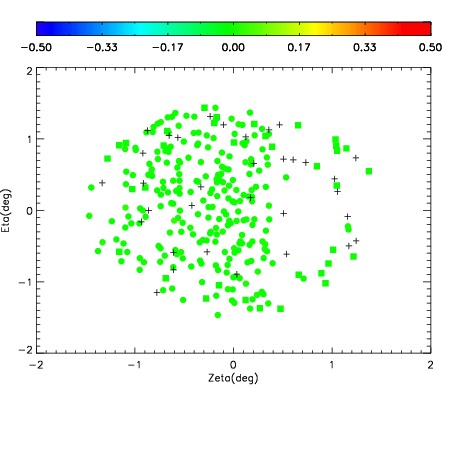
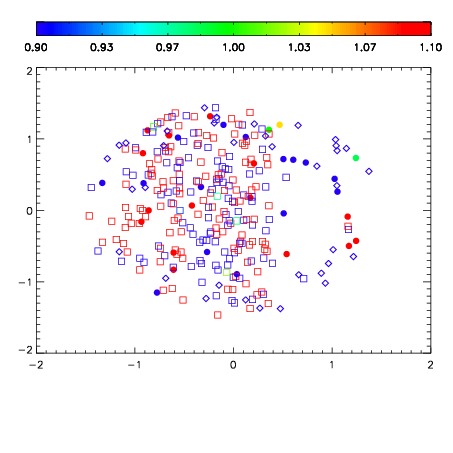
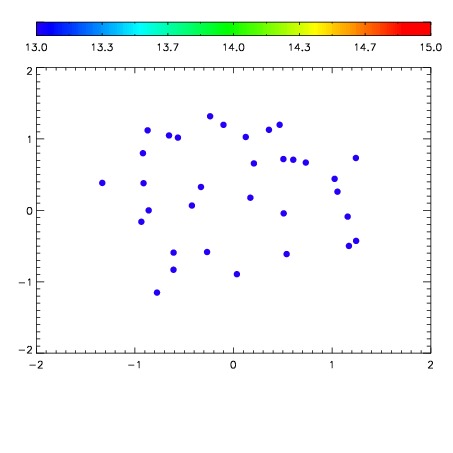

| Frame | Nreads | Zeropoints | Mag plots | Spatial mag deviation | Spatial sky 16325A emission deviations (filled: sky, open: star) | Spatial sky continuum emission | Spatial sky telluric CO2 absorption deviations (filled: H < 10) | |||||||||||||||||||||||
| 0 | 0 |
|
|
|
|
|
|
| IPAIR | NAME | SHIFT | NEWSHIFT | S/N | NAME | SHIFT | NEWSHIFT | S/N |
| 0 | 02890077 | 0.399337 | 0.00000 | 18.7860 | 02890078 | 0.00170828 | 0.397629 | 18.9152 |
| 1 | 02890072 | 0.394047 | 0.00529000 | 18.9835 | 02890075 | -0.00186195 | 0.401199 | 18.9978 |
| 2 | 02890073 | 0.395523 | 0.00381398 | 18.9795 | 02890071 | 0.00000 | 0.399337 | 18.9921 |
| 3 | 02890076 | 0.397823 | 0.00151399 | 18.9338 | 02890074 | 0.00140031 | 0.397937 | 18.9791 |