| Red | Green | Blue | |
| z | 17.64 | ||
| znorm | Inf | ||
| sky | -NaN | -NaN | -NaN |
| S/N | 24.8 | 40.4 | 40.1 |
| S/N(c) | 0.0 | 0.0 | 0.0 |
| SN(E/C) |
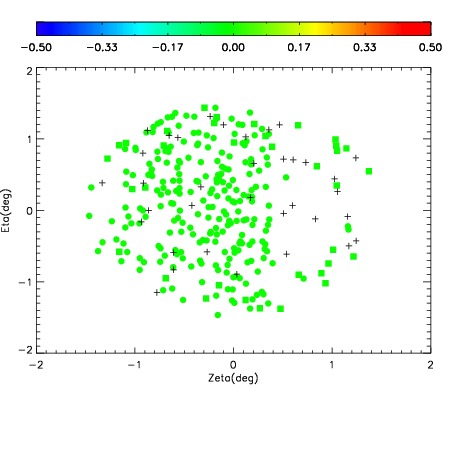
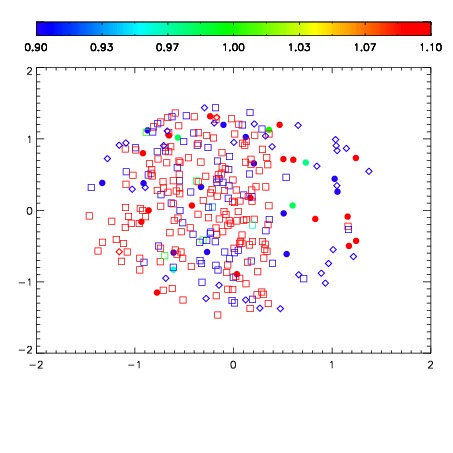
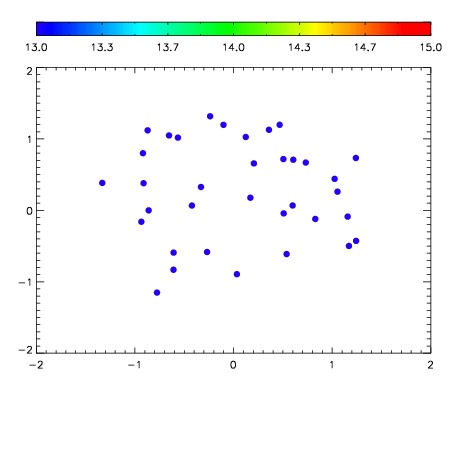

| Frame | Nreads | Zeropoints | Mag plots | Spatial mag deviation | Spatial sky 16325A emission deviations (filled: sky, open: star) | Spatial sky continuum emission | Spatial sky telluric CO2 absorption deviations (filled: H < 10) | |||||||||||||||||||||||
| 0 | 0 |
|
|
|
|
|
|
| IPAIR | NAME | SHIFT | NEWSHIFT | S/N | NAME | SHIFT | NEWSHIFT | S/N |
| 0 | 02920025 | 0.403237 | 0.00000 | 18.9410 | 02920023 | 0.00000 | 0.403237 | 18.9955 |
| 1 | 02920024 | 0.401777 | 0.00145999 | 18.9173 | 02920030 | 0.00222717 | 0.401010 | 18.9545 |
| 2 | 02920029 | 0.402822 | 0.000414997 | 18.9146 | 02920027 | -0.000783385 | 0.404020 | 18.9091 |
| 3 | 02920028 | 0.401448 | 0.00178897 | 18.8834 | 02920026 | 0.000415330 | 0.402822 | 18.8456 |