| Red | Green | Blue | |
| z | 17.64 | ||
| znorm | Inf | ||
| sky | -NaN | -NaN | -Inf |
| S/N | 23.8 | 41.8 | 44.0 |
| S/N(c) | 0.0 | 0.0 | 0.0 |
| SN(E/C) |


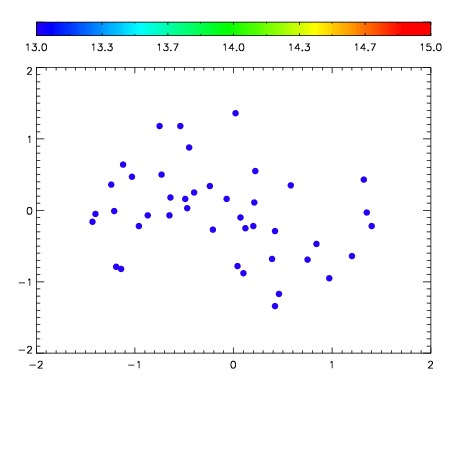

| Frame | Nreads | Zeropoints | Mag plots | Spatial mag deviation | Spatial sky 16325A emission deviations (filled: sky, open: star) | Spatial sky continuum emission | Spatial sky telluric CO2 absorption deviations (filled: H < 10) | |||||||||||||||||||||||
| 0 | 0 |
|
|
|
|
|
|
| IPAIR | NAME | SHIFT | NEWSHIFT | S/N | NAME | SHIFT | NEWSHIFT | S/N |
| 0 | 02920047 | 0.398300 | 0.00000 | 19.0311 | 02920045 | 0.00000 | 0.398300 | 18.9692 |
| 1 | 02920051 | 0.396841 | 0.00145900 | 19.0874 | 02920052 | -0.000411144 | 0.398711 | 19.0696 |
| 2 | 02920050 | 0.395725 | 0.00257498 | 19.0752 | 02920048 | 0.00168565 | 0.396614 | 19.0619 |
| 3 | 02920046 | 0.398063 | 0.000236988 | 19.0474 | 02920049 | -0.000634481 | 0.398934 | 19.0532 |