| Red | Green | Blue | |
| z | 17.64 | ||
| znorm | Inf | ||
| sky | -Inf | -Inf | -Inf |
| S/N | 24.3 | 42.7 | 42.4 |
| S/N(c) | 0.0 | 0.0 | 0.0 |
| SN(E/C) |
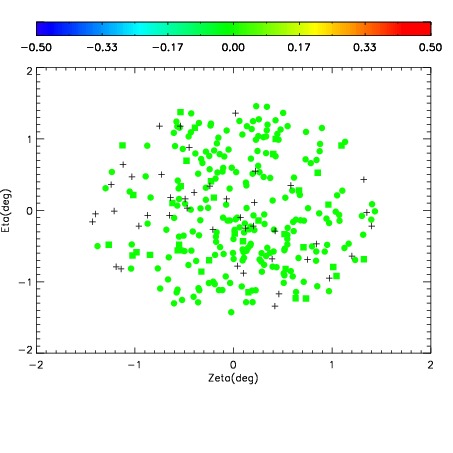
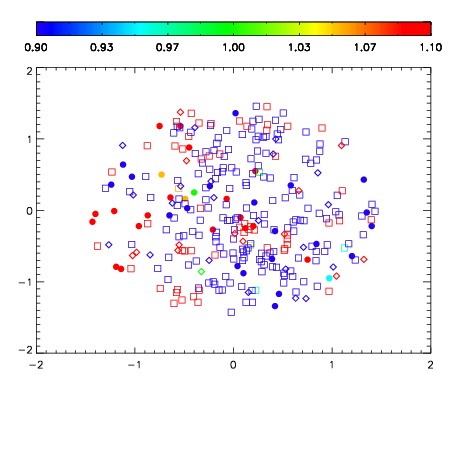
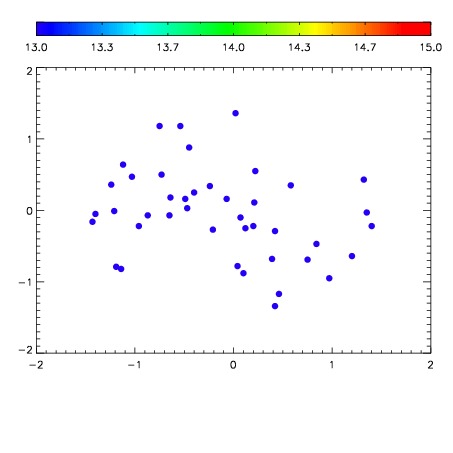

| Frame | Nreads | Zeropoints | Mag plots | Spatial mag deviation | Spatial sky 16325A emission deviations (filled: sky, open: star) | Spatial sky continuum emission | Spatial sky telluric CO2 absorption deviations (filled: H < 10) | |||||||||||||||||||||||
| 0 | 0 |
|
|
|
|
|
|
| IPAIR | NAME | SHIFT | NEWSHIFT | S/N | NAME | SHIFT | NEWSHIFT | S/N |
| 0 | 03190051 | 0.497824 | 0.00000 | 19.0421 | 03190048 | -0.000268705 | 0.498093 | 19.0274 |
| 1 | 03190050 | 0.495079 | 0.00274500 | 19.0429 | 03190049 | -0.000666170 | 0.498490 | 19.0352 |
| 2 | 03190047 | 0.496483 | 0.00134102 | 18.9743 | 03190052 | 0.00207326 | 0.495751 | 19.0002 |
| 3 | 03190046 | 0.495946 | 0.00187802 | 18.8335 | 03190045 | 0.00000 | 0.497824 | 18.7757 |