| Red | Green | Blue | |
| z | 17.64 | ||
| znorm | Inf | ||
| sky | -Inf | -Inf | -Inf |
| S/N | 26.7 | 42.8 | 48.6 |
| S/N(c) | 0.0 | 0.0 | 0.0 |
| SN(E/C) |
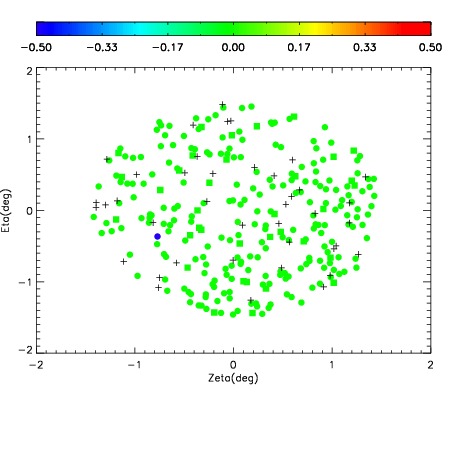
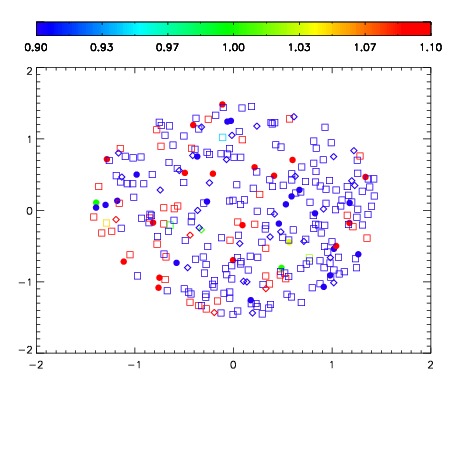


| Frame | Nreads | Zeropoints | Mag plots | Spatial mag deviation | Spatial sky 16325A emission deviations (filled: sky, open: star) | Spatial sky continuum emission | Spatial sky telluric CO2 absorption deviations (filled: H < 10) | |||||||||||||||||||||||
| 0 | 0 |
|
|
|
|
|
|
| IPAIR | NAME | SHIFT | NEWSHIFT | S/N | NAME | SHIFT | NEWSHIFT | S/N |
| 0 | 12720062 | 0.484325 | 0.00000 | 19.0802 | 12720063 | -0.00309715 | 0.487422 | 19.1075 |
| 1 | 12720065 | 0.480364 | 0.00396100 | 19.0872 | 12720064 | -0.00336182 | 0.487687 | 19.1168 |
| 2 | 12720061 | 0.484321 | 3.99351e-06 | 19.0592 | 12720067 | -0.00281351 | 0.487139 | 19.0414 |
| 3 | 12720066 | 0.481567 | 0.00275800 | 19.0379 | 12720060 | 0.00000 | 0.484325 | 19.0355 |