| Red | Green | Blue | |
| z | 17.64 | ||
| znorm | Inf | ||
| sky | -Inf | -Inf | -Inf |
| S/N | 26.4 | 45.4 | 48.0 |
| S/N(c) | 0.0 | 0.0 | 0.0 |
| SN(E/C) |
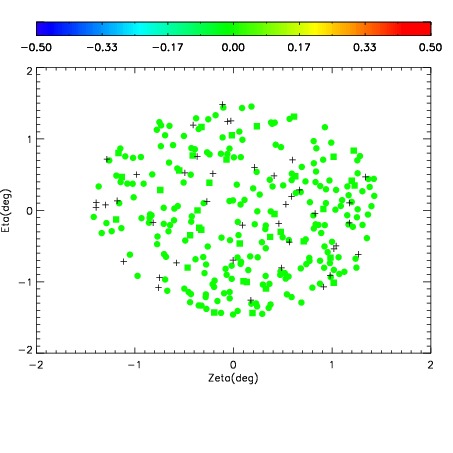
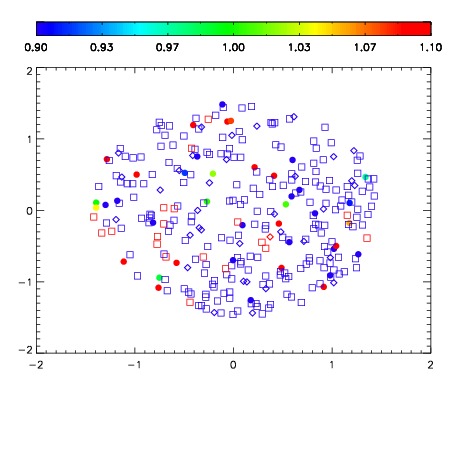


| Frame | Nreads | Zeropoints | Mag plots | Spatial mag deviation | Spatial sky 16325A emission deviations (filled: sky, open: star) | Spatial sky continuum emission | Spatial sky telluric CO2 absorption deviations (filled: H < 10) | |||||||||||||||||||||||
| 0 | 0 |
|
|
|
|
|
|
| IPAIR | NAME | SHIFT | NEWSHIFT | S/N | NAME | SHIFT | NEWSHIFT | S/N |
| 0 | 12740059 | 0.456188 | 0.00000 | 19.0247 | 12740061 | -0.00490354 | 0.461092 | 19.0826 |
| 1 | 12740063 | 0.451732 | 0.00445598 | 19.1648 | 12740062 | -0.00482995 | 0.461018 | 19.1349 |
| 2 | 12740064 | 0.452611 | 0.00357699 | 19.1346 | 12740065 | -0.00409849 | 0.460286 | 19.1087 |
| 3 | 12740060 | 0.455755 | 0.000432998 | 19.0172 | 12740058 | 0.00000 | 0.456188 | 19.0197 |