| Red | Green | Blue | |
| z | 17.64 | ||
| znorm | Inf | ||
| sky | -Inf | -NaN | -Inf |
| S/N | 26.1 | 43.4 | 47.6 |
| S/N(c) | 0.0 | 0.0 | 0.0 |
| SN(E/C) |
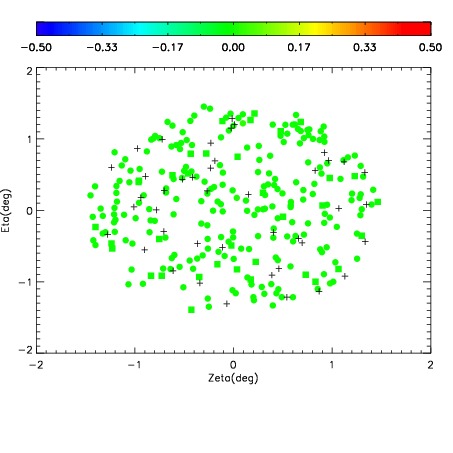
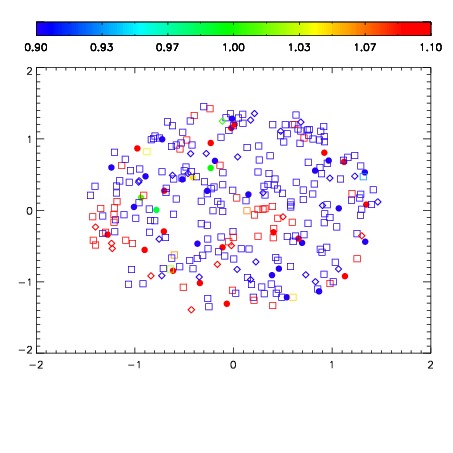


| Frame | Nreads | Zeropoints | Mag plots | Spatial mag deviation | Spatial sky 16325A emission deviations (filled: sky, open: star) | Spatial sky continuum emission | Spatial sky telluric CO2 absorption deviations (filled: H < 10) | |||||||||||||||||||||||
| 0 | 0 |
|
|
|
|
|
|
| IPAIR | NAME | SHIFT | NEWSHIFT | S/N | NAME | SHIFT | NEWSHIFT | S/N |
| 0 | 09040046 | 0.480680 | 0.00000 | 19.1445 | 09040047 | 0.00233665 | 0.478343 | 19.1534 |
| 1 | 09040045 | 0.480308 | 0.000371993 | 19.0717 | 09040048 | 0.00245475 | 0.478225 | 19.1434 |
| 2 | 09040049 | 0.479904 | 0.000775993 | 19.0530 | 09040051 | 0.000608167 | 0.480072 | 18.9675 |
| 3 | 09040050 | 0.480423 | 0.000256985 | 18.9733 | 09040044 | 0.00000 | 0.480680 | 18.9401 |