| Red | Green | Blue | |
| z | 17.64 | ||
| znorm | Inf | ||
| sky | -Inf | -Inf | -Inf |
| S/N | 25.5 | 42.6 | 46.3 |
| S/N(c) | 0.0 | 0.0 | 0.0 |
| SN(E/C) |
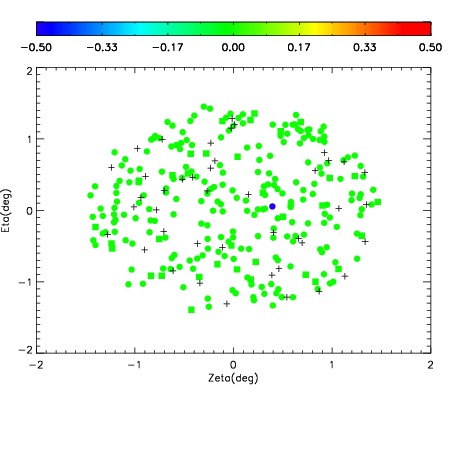
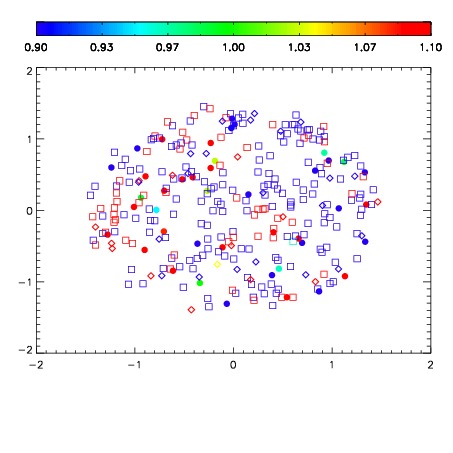


| Frame | Nreads | Zeropoints | Mag plots | Spatial mag deviation | Spatial sky 16325A emission deviations (filled: sky, open: star) | Spatial sky continuum emission | Spatial sky telluric CO2 absorption deviations (filled: H < 10) | |||||||||||||||||||||||
| 0 | 0 |
|
|
|
|
|
|
| IPAIR | NAME | SHIFT | NEWSHIFT | S/N | NAME | SHIFT | NEWSHIFT | S/N |
| 0 | 09810028 | 0.522306 | 0.00000 | 19.0307 | 09810029 | 0.00462787 | 0.517678 | 19.0904 |
| 1 | 09810027 | 0.521861 | 0.000445008 | 18.9682 | 09810025 | 0.00429841 | 0.518008 | 19.0171 |
| 2 | 09810023 | 0.520983 | 0.00132304 | 18.9354 | 09810022 | 0.00000 | 0.522306 | 18.9496 |
| 3 | 09810024 | 0.521602 | 0.000704050 | 18.9315 | 09810026 | 0.00432854 | 0.517977 | 18.9193 |