| Red | Green | Blue | |
| z | 17.64 | ||
| znorm | Inf | ||
| sky | -Inf | -Inf | -Inf |
| S/N | 24.4 | 41.5 | 46.7 |
| S/N(c) | 0.0 | 0.0 | 0.0 |
| SN(E/C) |
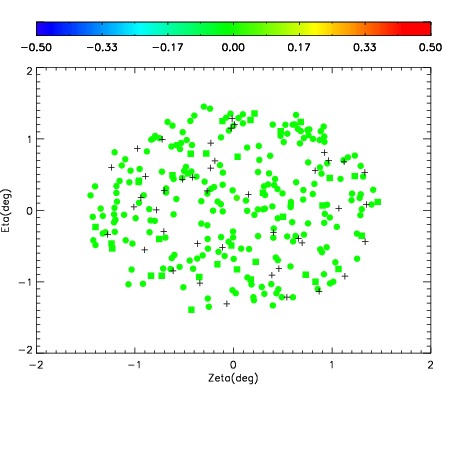


| Frame | Nreads | Zeropoints | Mag plots | Spatial mag deviation | Spatial sky 16325A emission deviations (filled: sky, open: star) | Spatial sky continuum emission | Spatial sky telluric CO2 absorption deviations (filled: H < 10) | |||||||||||||||||||||||
| 0 | 0 |
|
|
|
|
|
|
| IPAIR | NAME | SHIFT | NEWSHIFT | S/N | NAME | SHIFT | NEWSHIFT | S/N |
| 0 | 10000015 | 0.468527 | 0.00000 | 18.2615 | 10000014 | 0.00339576 | 0.465131 | 17.7233 |
| 1 | 10000016 | 0.467127 | 0.00139999 | 19.2255 | 10000017 | 0.00521623 | 0.463311 | 19.2613 |
| 2 | 10000012 | 0.467157 | 0.00136998 | 19.2056 | 10000010 | 0.00000 | 0.468527 | 19.1755 |
| 3 | 10000011 | 0.467000 | 0.00152698 | 19.2002 | 10000013 | 0.00270520 | 0.465822 | 18.9926 |