| Red | Green | Blue | |
| z | 17.64 | ||
| znorm | Inf | ||
| sky | -NaN | -NaN | -Inf |
| S/N | 26.9 | 44.6 | 49.2 |
| S/N(c) | 0.0 | 0.0 | 0.0 |
| SN(E/C) |
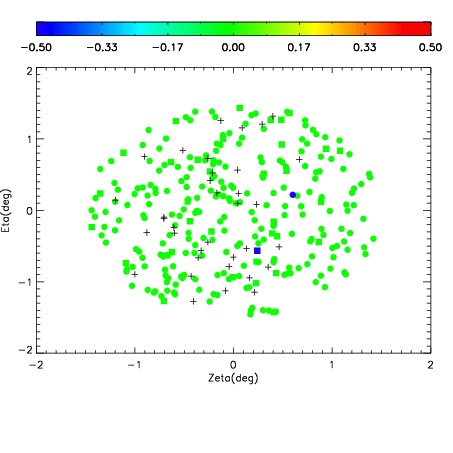
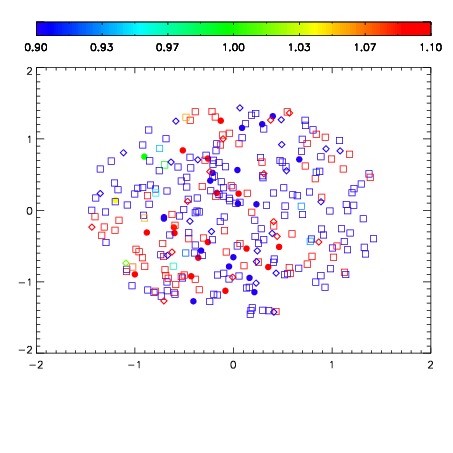


| Frame | Nreads | Zeropoints | Mag plots | Spatial mag deviation | Spatial sky 16325A emission deviations (filled: sky, open: star) | Spatial sky continuum emission | Spatial sky telluric CO2 absorption deviations (filled: H < 10) | |||||||||||||||||||||||
| 0 | 0 |
|
|
|
|
|
|
| IPAIR | NAME | SHIFT | NEWSHIFT | S/N | NAME | SHIFT | NEWSHIFT | S/N |
| 0 | 10160030 | 0.504867 | 0.00000 | 19.1828 | 10160031 | 0.00426945 | 0.500598 | 19.1614 |
| 1 | 10160029 | 0.503694 | 0.00117302 | 19.1614 | 10160032 | 0.00380302 | 0.501064 | 19.1608 |
| 2 | 10160033 | 0.503460 | 0.00140703 | 19.1012 | 10160028 | 0.00000 | 0.504867 | 19.1178 |
| 3 | 10160034 | 0.504002 | 0.000865042 | 19.0570 | 10160035 | 0.00502933 | 0.499838 | 19.0242 |