| Red | Green | Blue | |
| z | 17.64 | ||
| znorm | Inf | ||
| sky | -Inf | -Inf | -Inf |
| S/N | 28.4 | 45.3 | 50.4 |
| S/N(c) | 0.0 | 0.0 | 0.0 |
| SN(E/C) |
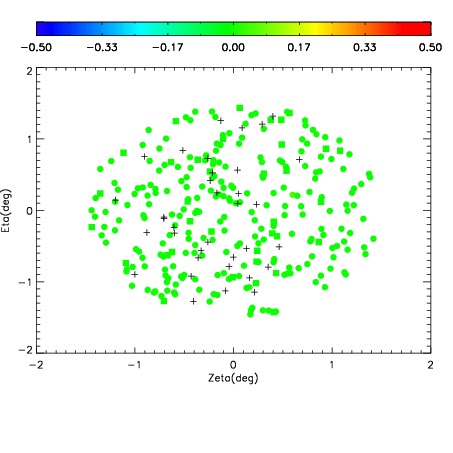
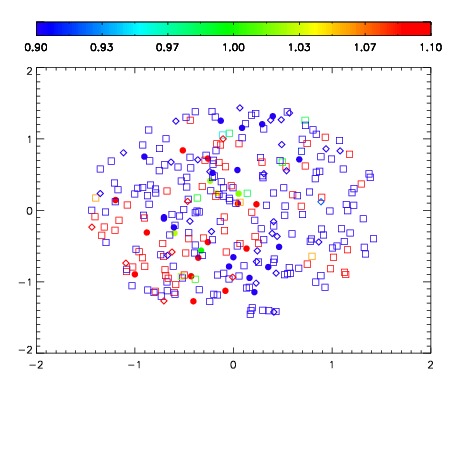
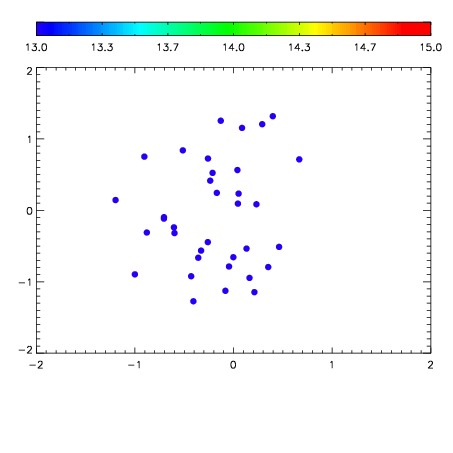

| Frame | Nreads | Zeropoints | Mag plots | Spatial mag deviation | Spatial sky 16325A emission deviations (filled: sky, open: star) | Spatial sky continuum emission | Spatial sky telluric CO2 absorption deviations (filled: H < 10) | |||||||||||||||||||||||
| 0 | 0 |
|
|
|
|
|
|
| IPAIR | NAME | SHIFT | NEWSHIFT | S/N | NAME | SHIFT | NEWSHIFT | S/N |
| 0 | 10210031 | 0.493990 | 0.00000 | 19.1924 | 10210026 | 0.00000 | 0.493990 | 19.1887 |
| 1 | 10210032 | 0.493525 | 0.000465006 | 19.1747 | 10210030 | 0.000862829 | 0.493127 | 19.1827 |
| 2 | 10210028 | 0.493511 | 0.000479013 | 19.1545 | 10210033 | -8.61292e-05 | 0.494076 | 19.1609 |
| 3 | 10210027 | 0.493538 | 0.000452012 | 19.1536 | 10210029 | 0.00104206 | 0.492948 | 19.1562 |