| Red | Green | Blue | |
| z | 17.64 | ||
| znorm | Inf | ||
| sky | -NaN | -NaN | -Inf |
| S/N | 26.1 | 43.8 | 48.5 |
| S/N(c) | 0.0 | 0.0 | 0.0 |
| SN(E/C) |
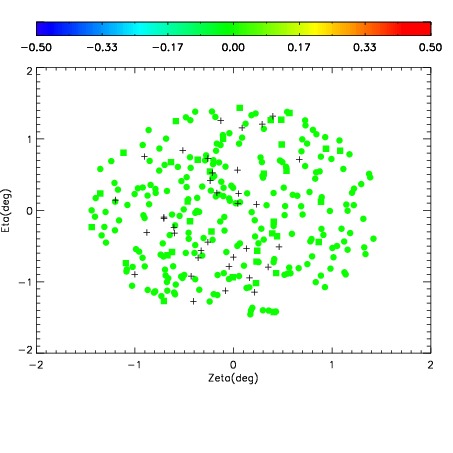

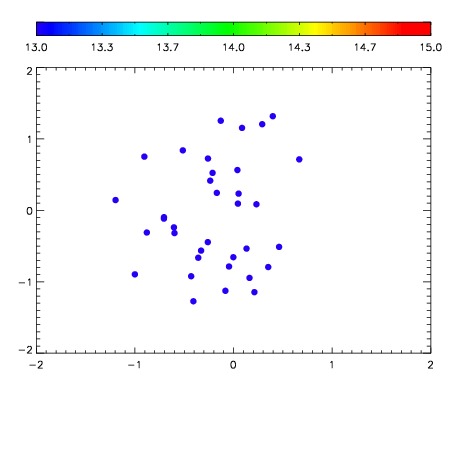

| Frame | Nreads | Zeropoints | Mag plots | Spatial mag deviation | Spatial sky 16325A emission deviations (filled: sky, open: star) | Spatial sky continuum emission | Spatial sky telluric CO2 absorption deviations (filled: H < 10) | |||||||||||||||||||||||
| 0 | 0 |
|
|
|
|
|
|
| IPAIR | NAME | SHIFT | NEWSHIFT | S/N | NAME | SHIFT | NEWSHIFT | S/N |
| 0 | 10430013 | 0.510741 | 0.00000 | 18.9779 | 10430018 | 0.0126882 | 0.498053 | 19.0338 |
| 1 | 10430016 | 0.508623 | 0.00211799 | 19.1064 | 10430015 | 0.00122699 | 0.509514 | 19.1143 |
| 2 | 10430012 | 0.510587 | 0.000154018 | 19.0499 | 10430014 | 0.00153978 | 0.509201 | 19.0553 |
| 3 | 10430017 | 0.508769 | 0.00197202 | 19.0426 | 10430011 | 0.00000 | 0.510741 | 19.0483 |