| Red | Green | Blue | |
| z | 17.64 | ||
| znorm | Inf | ||
| sky | -Inf | -Inf | -Inf |
| S/N | 29.9 | 50.9 | 53.9 |
| S/N(c) | 0.0 | 0.0 | 0.0 |
| SN(E/C) |

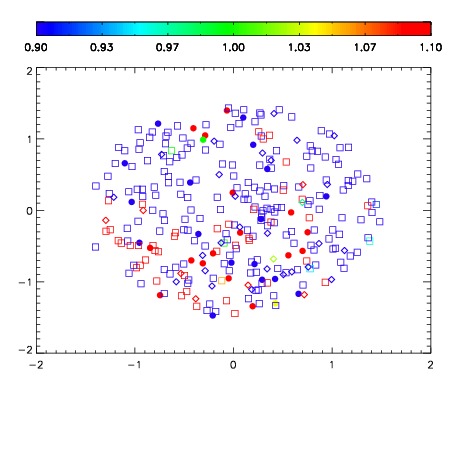


| Frame | Nreads | Zeropoints | Mag plots | Spatial mag deviation | Spatial sky 16325A emission deviations (filled: sky, open: star) | Spatial sky continuum emission | Spatial sky telluric CO2 absorption deviations (filled: H < 10) | |||||||||||||||||||||||
| 0 | 0 |
|
|
|
|
|
|
| IPAIR | NAME | SHIFT | NEWSHIFT | S/N | NAME | SHIFT | NEWSHIFT | S/N |
| 0 | 10250043 | 0.497940 | 0.00000 | 18.9962 | 10250044 | 7.08128e-05 | 0.497869 | 19.0429 |
| 1 | 10250038 | 0.496126 | 0.00181401 | 19.1918 | 10250037 | 0.00000 | 0.497940 | 19.1980 |
| 2 | 10250039 | 0.496173 | 0.00176701 | 19.1447 | 10250040 | 0.00286965 | 0.495070 | 19.1684 |
| 3 | 10250042 | 0.497570 | 0.000369996 | 19.0027 | 10250041 | 0.00250890 | 0.495431 | 19.1279 |