| Red | Green | Blue | |
| z | 17.64 | ||
| znorm | Inf | ||
| sky | -NaN | -NaN | -NaN |
| S/N | 30.2 | 50.7 | 54.7 |
| S/N(c) | 0.0 | 0.0 | 0.0 |
| SN(E/C) |
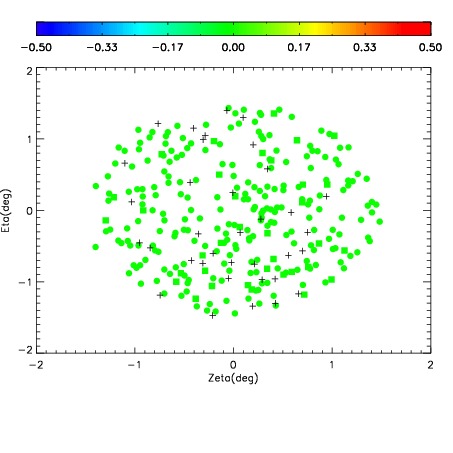

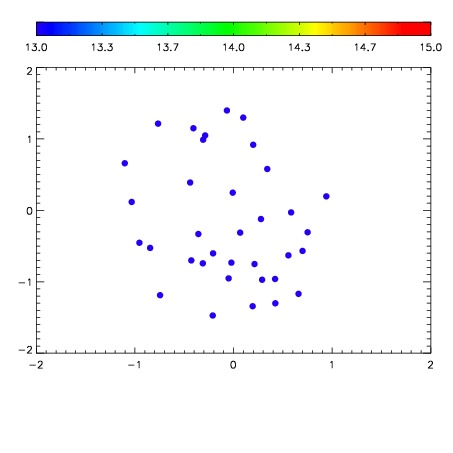

| Frame | Nreads | Zeropoints | Mag plots | Spatial mag deviation | Spatial sky 16325A emission deviations (filled: sky, open: star) | Spatial sky continuum emission | Spatial sky telluric CO2 absorption deviations (filled: H < 10) | |||||||||||||||||||||||
| 0 | 0 |
|
|
|
|
|
|
| IPAIR | NAME | SHIFT | NEWSHIFT | S/N | NAME | SHIFT | NEWSHIFT | S/N |
| 0 | 10430035 | 0.499744 | 0.00000 | 19.1834 | 10430033 | 0.00000 | 0.499744 | 19.1853 |
| 1 | 10430039 | 0.498319 | 0.00142500 | 19.2056 | 10430036 | 0.00175021 | 0.497994 | 19.2025 |
| 2 | 10430034 | 0.499468 | 0.000275999 | 19.1854 | 10430037 | 0.00156905 | 0.498175 | 19.1865 |
| 3 | 10430038 | 0.497967 | 0.00177699 | 19.1745 | 10430040 | 0.00301953 | 0.496724 | 19.1546 |