| Red | Green | Blue | |
| z | 17.64 | ||
| znorm | Inf | ||
| sky | -Inf | -Inf | -Inf |
| S/N | 23.7 | 40.5 | 45.2 |
| S/N(c) | 0.0 | 0.0 | 0.0 |
| SN(E/C) |
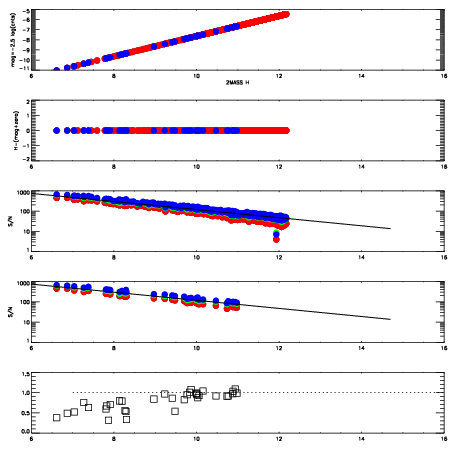
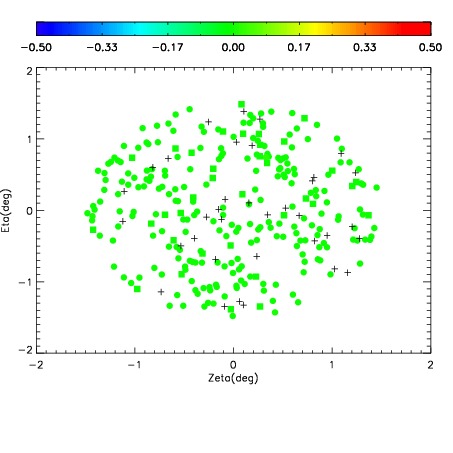
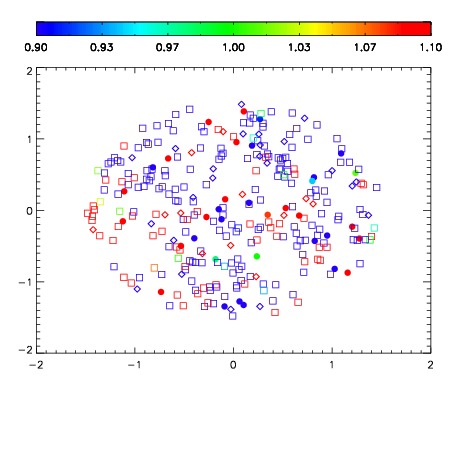
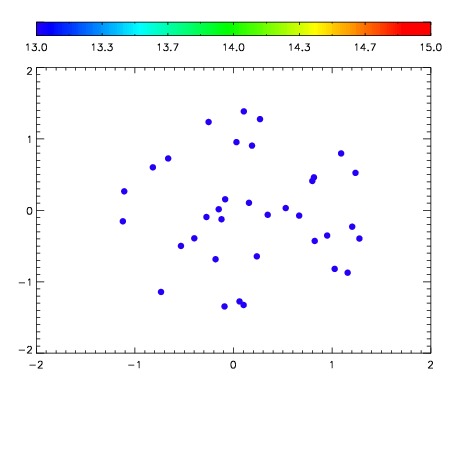

| Frame | Nreads | Zeropoints | Mag plots | Spatial mag deviation | Spatial sky 16325A emission deviations (filled: sky, open: star) | Spatial sky continuum emission | Spatial sky telluric CO2 absorption deviations (filled: H < 10) | |||||||||||||||||||||||
| 0 | 0 |
|
|
|
|
|
|
| IPAIR | NAME | SHIFT | NEWSHIFT | S/N | NAME | SHIFT | NEWSHIFT | S/N |
| 0 | 02820074 | 0.415338 | 0.00000 | 19.0091 | 02820072 | 0.000695065 | 0.414643 | 19.0386 |
| 1 | 02820073 | 0.411427 | 0.00391102 | 19.0246 | 02820075 | 0.000129097 | 0.415209 | 19.0551 |
| 2 | 02820070 | 0.413490 | 0.00184801 | 18.8773 | 02820071 | 0.00176513 | 0.413573 | 18.9933 |
| 3 | 02820069 | 0.409923 | 0.00541502 | 18.7464 | 02820068 | 0.00000 | 0.415338 | 18.6218 |