| Red | Green | Blue | |
| z | 17.64 | ||
| znorm | Inf | ||
| sky | -NaN | -Inf | -NaN |
| S/N | 23.7 | 41.5 | 45.4 |
| S/N(c) | 0.0 | 0.0 | 0.0 |
| SN(E/C) |
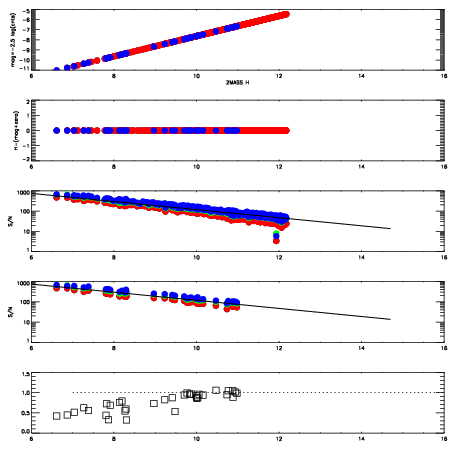
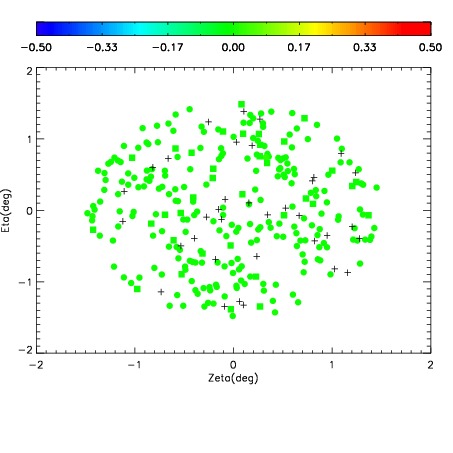
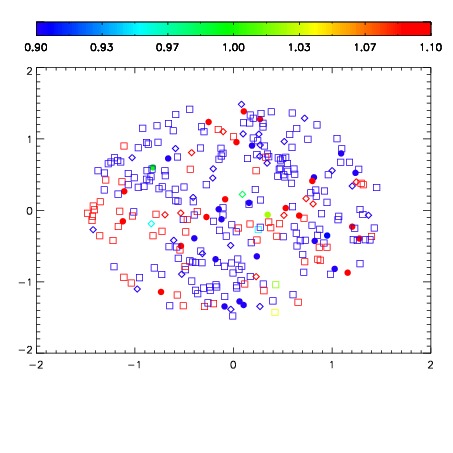
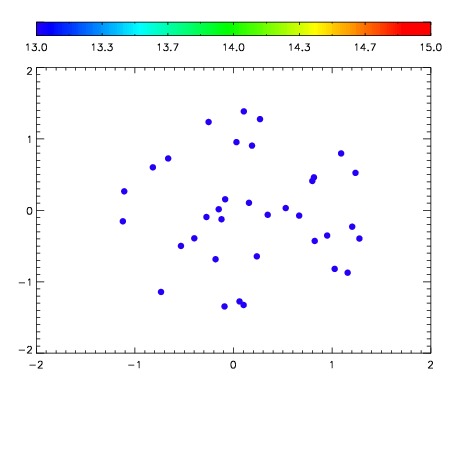

| Frame | Nreads | Zeropoints | Mag plots | Spatial mag deviation | Spatial sky 16325A emission deviations (filled: sky, open: star) | Spatial sky continuum emission | Spatial sky telluric CO2 absorption deviations (filled: H < 10) | |||||||||||||||||||||||
| 0 | 0 |
|
|
|
|
|
|
| IPAIR | NAME | SHIFT | NEWSHIFT | S/N | NAME | SHIFT | NEWSHIFT | S/N |
| 0 | 02830072 | 0.414633 | 0.00000 | 18.9830 | 02830073 | 0.00422078 | 0.410412 | 19.0074 |
| 1 | 02830075 | 0.411590 | 0.00304300 | 19.0402 | 02830074 | 0.000466309 | 0.414167 | 19.0378 |
| 2 | 02830076 | 0.412091 | 0.00254202 | 18.9680 | 02830070 | 0.00000 | 0.414633 | 18.9644 |
| 3 | 02830071 | 0.413871 | 0.000762016 | 18.9098 | 02830077 | 0.00301484 | 0.411618 | 18.8952 |