| Red | Green | Blue | |
| z | 17.64 | ||
| znorm | Inf | ||
| sky | -Inf | -Inf | -Inf |
| S/N | 25.6 | 42.7 | 45.1 |
| S/N(c) | 0.0 | 0.0 | 0.0 |
| SN(E/C) |
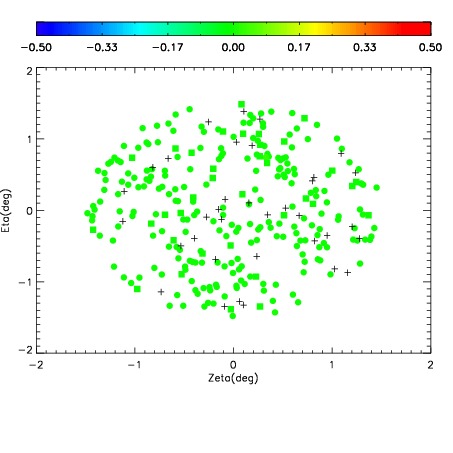
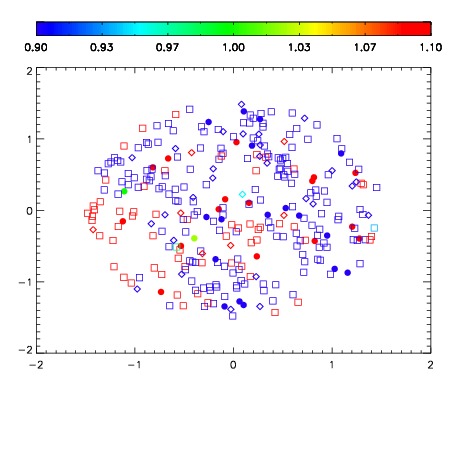


| Frame | Nreads | Zeropoints | Mag plots | Spatial mag deviation | Spatial sky 16325A emission deviations (filled: sky, open: star) | Spatial sky continuum emission | Spatial sky telluric CO2 absorption deviations (filled: H < 10) | |||||||||||||||||||||||
| 0 | 0 |
|
|
|
|
|
|
| IPAIR | NAME | SHIFT | NEWSHIFT | S/N | NAME | SHIFT | NEWSHIFT | S/N |
| 0 | 02880066 | 0.408674 | 0.00000 | 18.9872 | 02880067 | 0.00386515 | 0.404809 | 18.9597 |
| 1 | 02880061 | 0.404310 | 0.00436401 | 19.0561 | 02880060 | 0.00000 | 0.408674 | 19.0770 |
| 2 | 02880065 | 0.407426 | 0.00124800 | 18.9876 | 02880064 | -0.00159863 | 0.410273 | 18.9814 |
| 3 | 02880062 | 0.406158 | 0.00251600 | 18.9208 | 02880063 | 0.00211769 | 0.406556 | 18.9441 |