| Red | Green | Blue | |
| z | 17.64 | ||
| znorm | Inf | ||
| sky | -Inf | -Inf | -Inf |
| S/N | 25.2 | 43.5 | 47.2 |
| S/N(c) | 0.0 | 0.0 | 0.0 |
| SN(E/C) |

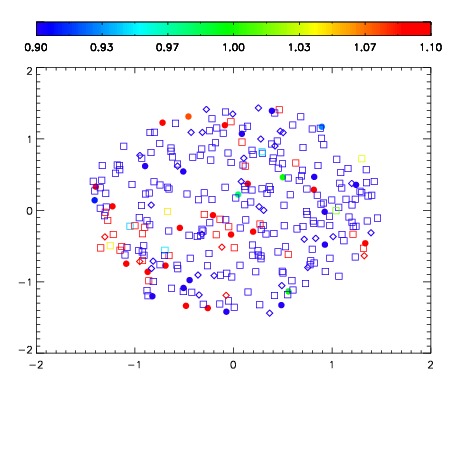
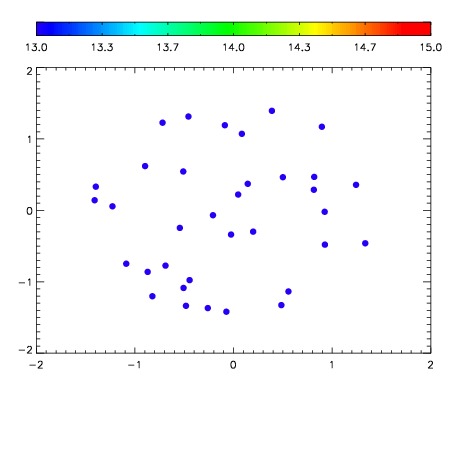

| Frame | Nreads | Zeropoints | Mag plots | Spatial mag deviation | Spatial sky 16325A emission deviations (filled: sky, open: star) | Spatial sky continuum emission | Spatial sky telluric CO2 absorption deviations (filled: H < 10) | |||||||||||||||||||||||
| 0 | 0 |
|
|
|
|
|
|
| IPAIR | NAME | SHIFT | NEWSHIFT | S/N | NAME | SHIFT | NEWSHIFT | S/N |
| 0 | 02890062 | 0.397231 | 0.00000 | 18.8739 | 02890063 | 0.00178163 | 0.395449 | 18.9824 |
| 1 | 02890066 | 0.394206 | 0.00302503 | 19.0538 | 02890067 | -0.000429319 | 0.397660 | 19.0497 |
| 2 | 02890065 | 0.393881 | 0.00335002 | 19.0509 | 02890064 | -0.00335427 | 0.400585 | 19.0265 |
| 3 | 02890061 | 0.396114 | 0.00111702 | 19.0214 | 02890060 | 0.00000 | 0.397231 | 19.0241 |