| Red | Green | Blue | |
| z | 17.64 | ||
| znorm | Inf | ||
| sky | -Inf | -Inf | -NaN |
| S/N | 24.1 | 41.7 | 44.5 |
| S/N(c) | 0.0 | 0.0 | 0.0 |
| SN(E/C) |


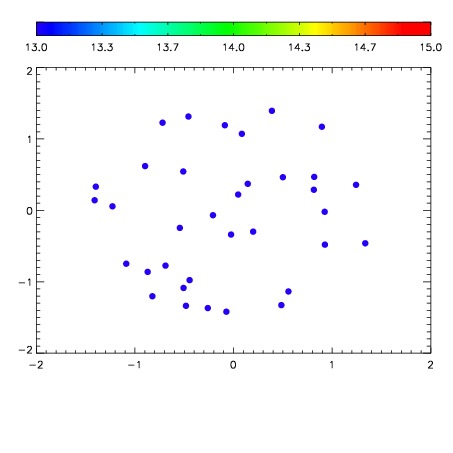

| Frame | Nreads | Zeropoints | Mag plots | Spatial mag deviation | Spatial sky 16325A emission deviations (filled: sky, open: star) | Spatial sky continuum emission | Spatial sky telluric CO2 absorption deviations (filled: H < 10) | |||||||||||||||||||||||
| 0 | 0 |
|
|
|
|
|
|
| IPAIR | NAME | SHIFT | NEWSHIFT | S/N | NAME | SHIFT | NEWSHIFT | S/N |
| 0 | 02920014 | 0.399341 | 0.00000 | 18.9140 | 02920012 | 0.000730500 | 0.398610 | 18.8343 |
| 1 | 02920010 | 0.396781 | 0.00255999 | 19.0432 | 02920011 | 0.000133459 | 0.399208 | 19.1101 |
| 2 | 02920009 | 0.395779 | 0.00356197 | 18.9192 | 02920015 | -0.000586596 | 0.399928 | 18.9306 |
| 3 | 02920013 | 0.397554 | 0.00178698 | 18.8820 | 02920008 | 0.00000 | 0.399341 | 18.7145 |