| Red | Green | Blue | |
| z | 17.64 | ||
| znorm | Inf | ||
| sky | -Inf | -Inf | -Inf |
| S/N | 22.2 | 39.1 | 42.1 |
| S/N(c) | 0.0 | 0.0 | 0.0 |
| SN(E/C) |
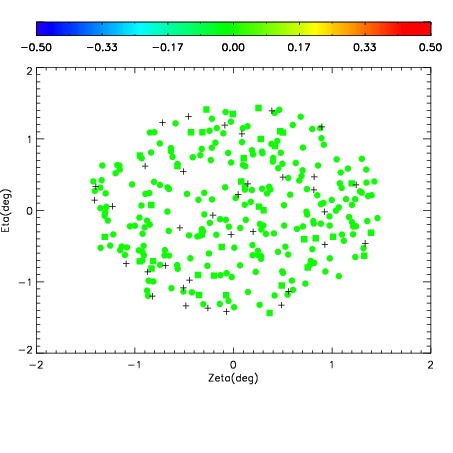
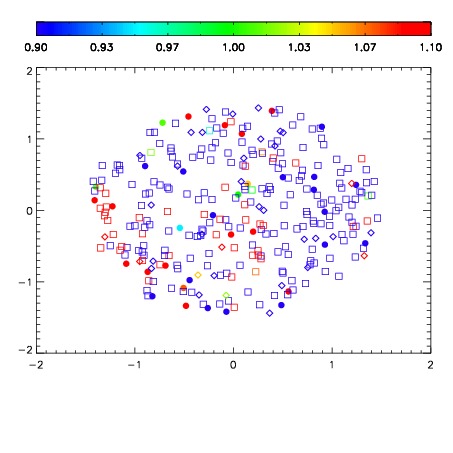


| Frame | Nreads | Zeropoints | Mag plots | Spatial mag deviation | Spatial sky 16325A emission deviations (filled: sky, open: star) | Spatial sky continuum emission | Spatial sky telluric CO2 absorption deviations (filled: H < 10) | |||||||||||||||||||||||
| 0 | 0 |
|
|
|
|
|
|
| IPAIR | NAME | SHIFT | NEWSHIFT | S/N | NAME | SHIFT | NEWSHIFT | S/N |
| 0 | 03100060 | 0.500571 | 0.00000 | 17.9507 | 03100058 | 0.00291036 | 0.497661 | 18.5276 |
| 1 | 03100056 | 0.495285 | 0.00528601 | 19.1662 | 03100054 | 0.00000 | 0.500571 | 19.1177 |
| 2 | 03100055 | 0.495232 | 0.00533903 | 19.1393 | 03100057 | 0.00565893 | 0.494912 | 19.0420 |
| 3 | 03100059 | 0.499810 | 0.000761002 | 18.0363 | 03100061 | 0.00767315 | 0.492898 | 18.5931 |