| Red | Green | Blue | |
| z | 17.64 | ||
| znorm | Inf | ||
| sky | -Inf | -Inf | -Inf |
| S/N | 23.6 | 40.5 | 42.5 |
| S/N(c) | 0.0 | 0.0 | 0.0 |
| SN(E/C) |


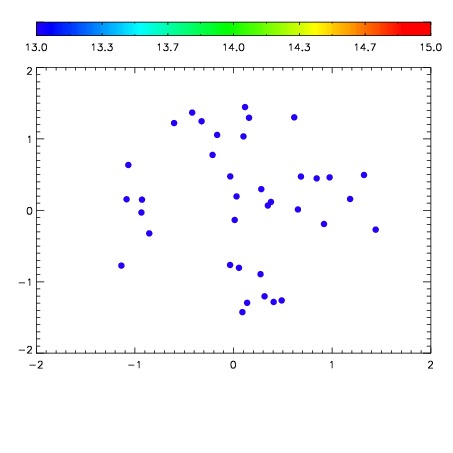

| Frame | Nreads | Zeropoints | Mag plots | Spatial mag deviation | Spatial sky 16325A emission deviations (filled: sky, open: star) | Spatial sky continuum emission | Spatial sky telluric CO2 absorption deviations (filled: H < 10) | |||||||||||||||||||||||
| 0 | 0 |
|
|
|
|
|
|
| IPAIR | NAME | SHIFT | NEWSHIFT | S/N | NAME | SHIFT | NEWSHIFT | S/N |
| 0 | 04050027 | 0.500517 | 0.00000 | 18.5975 | 04050025 | 0.00000 | 0.500517 | 18.6974 |
| 1 | 04050031 | 0.497633 | 0.00288400 | 18.8539 | 04050032 | 4.09528e-05 | 0.500476 | 18.8188 |
| 2 | 04050030 | 0.498192 | 0.00232500 | 18.8313 | 04050028 | 0.000516722 | 0.500000 | 18.7826 |
| 3 | 04050026 | 0.499831 | 0.000686020 | 18.6555 | 04050029 | -0.000584411 | 0.501101 | 18.6993 |