| Red | Green | Blue | |
| z | 17.64 | ||
| znorm | Inf | ||
| sky | -Inf | -Inf | -Inf |
| S/N | 28.3 | 46.1 | 50.1 |
| S/N(c) | 0.0 | 0.0 | 0.0 |
| SN(E/C) |
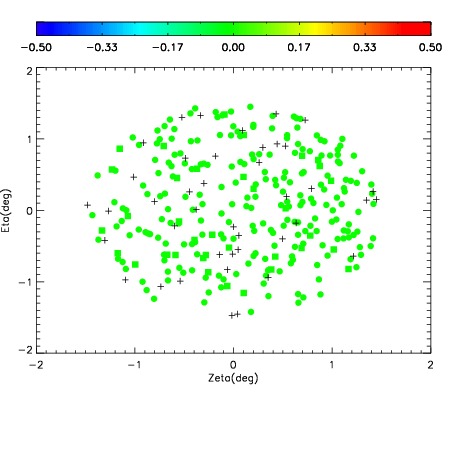
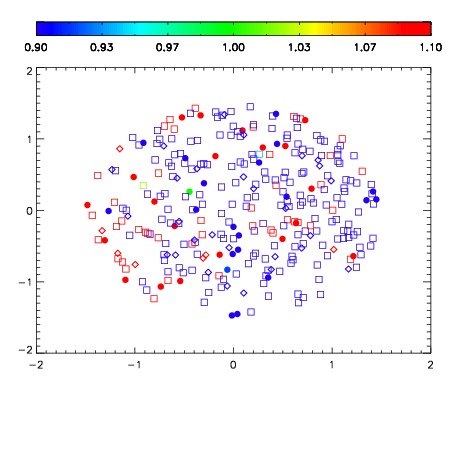


| Frame | Nreads | Zeropoints | Mag plots | Spatial mag deviation | Spatial sky 16325A emission deviations (filled: sky, open: star) | Spatial sky continuum emission | Spatial sky telluric CO2 absorption deviations (filled: H < 10) | |||||||||||||||||||||||
| 0 | 0 |
|
|
|
|
|
|
| IPAIR | NAME | SHIFT | NEWSHIFT | S/N | NAME | SHIFT | NEWSHIFT | S/N |
| 0 | 02850014 | 0.412432 | 0.00000 | 19.1625 | 02850015 | 0.00180168 | 0.410630 | 19.1598 |
| 1 | 02850018 | 0.411136 | 0.00129598 | 19.1895 | 02850019 | -0.000761387 | 0.413193 | 19.1904 |
| 2 | 02850017 | 0.409374 | 0.00305799 | 19.1652 | 02850016 | -0.000432575 | 0.412865 | 19.1603 |
| 3 | 02850013 | 0.411229 | 0.00120297 | 19.1601 | 02850012 | 0.00000 | 0.412432 | 19.1558 |