| Red | Green | Blue | |
| z | 17.64 | ||
| znorm | Inf | ||
| sky | -Inf | -Inf | -NaN |
| S/N | 18.0 | 32.8 | 34.2 |
| S/N(c) | 0.0 | 0.0 | 0.0 |
| SN(E/C) |
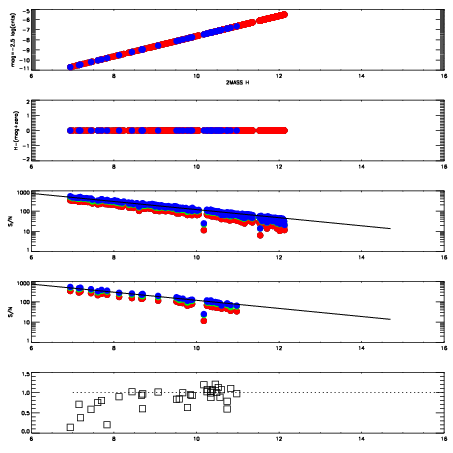
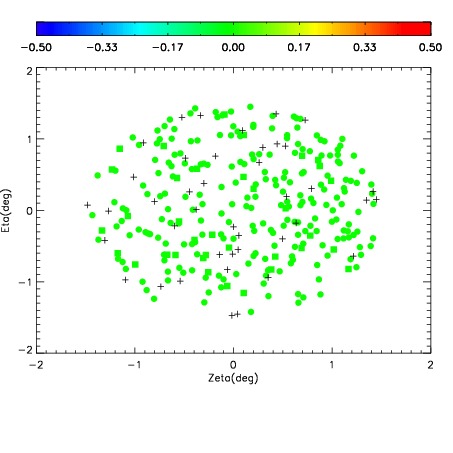
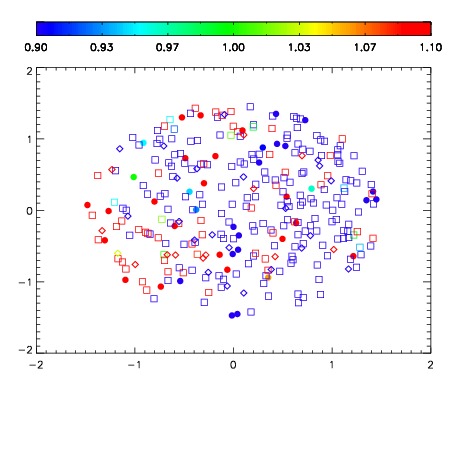
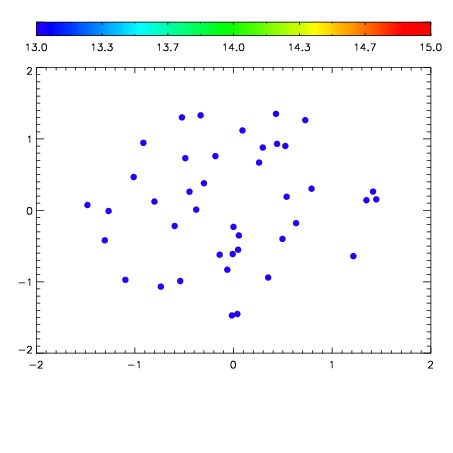

| Frame | Nreads | Zeropoints | Mag plots | Spatial mag deviation | Spatial sky 16325A emission deviations (filled: sky, open: star) | Spatial sky continuum emission | Spatial sky telluric CO2 absorption deviations (filled: H < 10) | |||||||||||||||||||||||
| 0 | 0 |
|
|
|
|
|
|
| IPAIR | NAME | SHIFT | NEWSHIFT | S/N | NAME | SHIFT | NEWSHIFT | S/N |
| 0 | 02900027 | 0.402609 | 0.00000 | 17.9758 | 02900028 | 0.000206670 | 0.402402 | 18.8567 |
| 1 | 02900030 | 0.399099 | 0.00351000 | 18.8818 | 02900029 | -0.000867778 | 0.403477 | 19.0116 |
| 2 | 02900031 | 0.400410 | 0.00219899 | 18.8423 | 02900032 | 0.000722590 | 0.401886 | 18.8807 |
| 3 | 02900026 | 0.401624 | 0.000984997 | 17.3504 | 02900025 | 0.00000 | 0.402609 | 17.2543 |