| Red | Green | Blue | |
| z | 17.64 | ||
| znorm | Inf | ||
| sky | -Inf | -Inf | -Inf |
| S/N | 16.7 | 28.2 | 33.6 |
| S/N(c) | 0.0 | 0.0 | 0.0 |
| SN(E/C) |
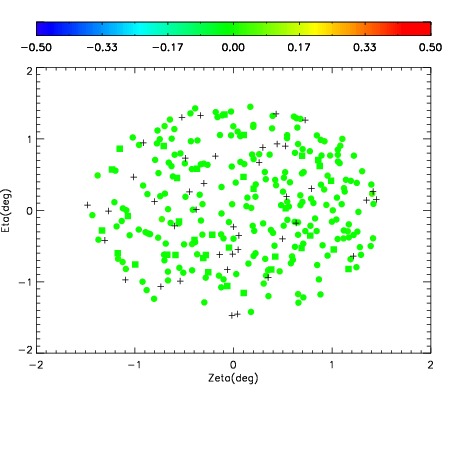
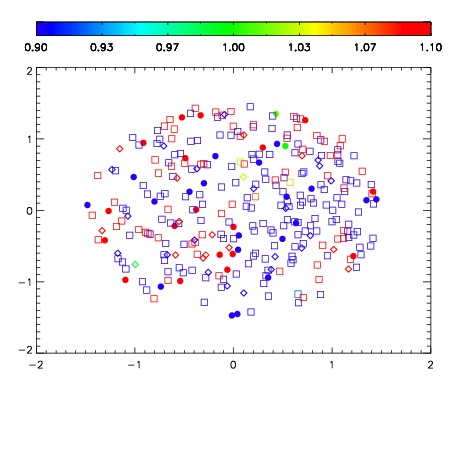


| Frame | Nreads | Zeropoints | Mag plots | Spatial mag deviation | Spatial sky 16325A emission deviations (filled: sky, open: star) | Spatial sky continuum emission | Spatial sky telluric CO2 absorption deviations (filled: H < 10) | |||||||||||||||||||||||
| 0 | 0 |
|
|
|
|
|
|
| IPAIR | NAME | SHIFT | NEWSHIFT | S/N | NAME | SHIFT | NEWSHIFT | S/N |
| 0 | 03990026 | 0.499704 | 0.00000 | 17.5618 | 03990027 | 0.00257276 | 0.497131 | 17.3239 |
| 1 | 03990021 | 0.496338 | 0.00336599 | 18.9145 | 03990023 | 0.000829854 | 0.498874 | 18.8402 |
| 2 | 03990022 | 0.498333 | 0.00137100 | 18.7045 | 03990020 | 0.00000 | 0.499704 | 18.7177 |
| 3 | 03990025 | 0.497489 | 0.00221500 | 18.0715 | 03990024 | 0.000227756 | 0.499476 | 17.9704 |