| Red | Green | Blue | |
| z | 17.64 | ||
| znorm | Inf | ||
| sky | -Inf | -Inf | -Inf |
| S/N | 16.2 | 28.6 | 31.0 |
| S/N(c) | 0.0 | 0.0 | 0.0 |
| SN(E/C) |
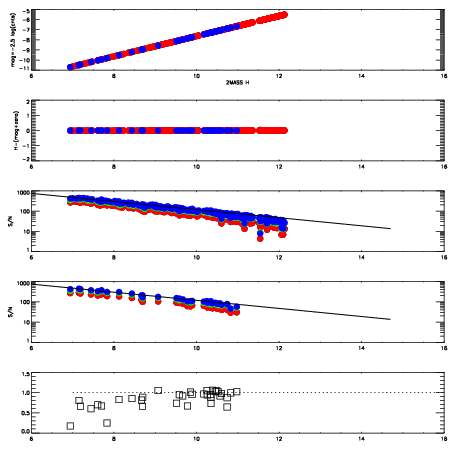
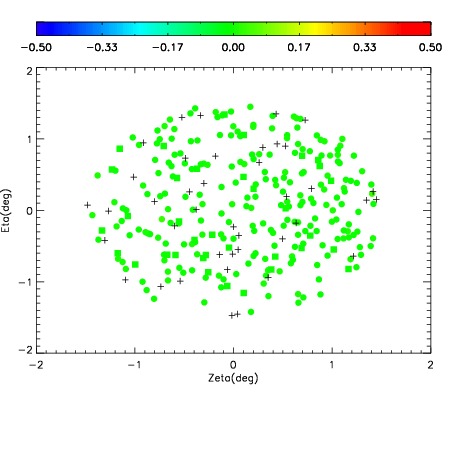
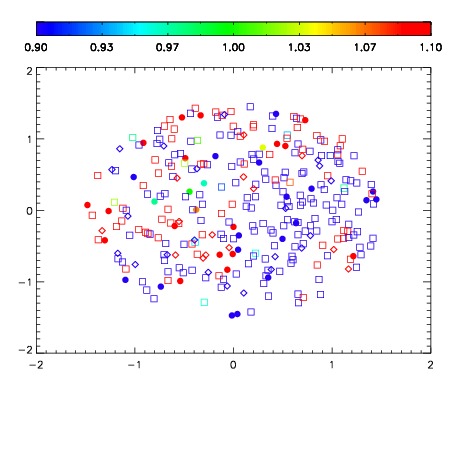
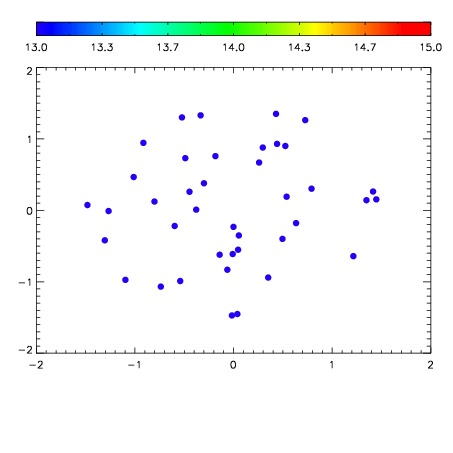

| Frame | Nreads | Zeropoints | Mag plots | Spatial mag deviation | Spatial sky 16325A emission deviations (filled: sky, open: star) | Spatial sky continuum emission | Spatial sky telluric CO2 absorption deviations (filled: H < 10) | |||||||||||||||||||||||
| 0 | 0 |
|
|
|
|
|
|
| IPAIR | NAME | SHIFT | NEWSHIFT | S/N | NAME | SHIFT | NEWSHIFT | S/N |
| 0 | 04010014 | 0.493583 | 0.00000 | 18.3071 | 04010015 | 0.00230947 | 0.491274 | 18.1750 |
| 1 | 04010009 | 0.491265 | 0.00231799 | 18.7314 | 04010008 | 0.00000 | 0.493583 | 19.0496 |
| 2 | 04010013 | 0.493266 | 0.000317007 | 18.2544 | 04010012 | 0.000296668 | 0.493286 | 18.1513 |
| 3 | 04010010 | 0.493449 | 0.000133991 | 17.6695 | 04010011 | 0.000536875 | 0.493046 | 17.5428 |