| Red | Green | Blue | |
| z | 17.64 | ||
| znorm | Inf | ||
| sky | -Inf | -Inf | -Inf |
| S/N | 27.0 | 46.7 | 51.2 |
| S/N(c) | 0.0 | 0.0 | 0.0 |
| SN(E/C) |

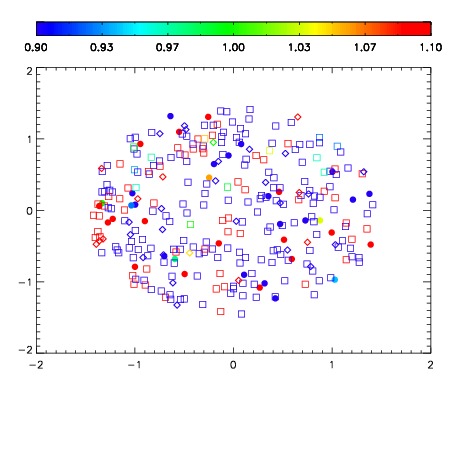


| Frame | Nreads | Zeropoints | Mag plots | Spatial mag deviation | Spatial sky 16325A emission deviations (filled: sky, open: star) | Spatial sky continuum emission | Spatial sky telluric CO2 absorption deviations (filled: H < 10) | |||||||||||||||||||||||
| 0 | 0 |
|
|
|
|
|
|
| IPAIR | NAME | SHIFT | NEWSHIFT | S/N | NAME | SHIFT | NEWSHIFT | S/N |
| 0 | 03210053 | 0.00000 | 0.00000 | 18.7939 | 03210059 | -0.509808 | 0.509808 | 19.1124 |
| 1 | 03210057 | -0.00694781 | 0.00694781 | 19.2230 | 03210058 | -0.508618 | 0.508618 | 19.2188 |
| 2 | 03210061 | -0.00444679 | 0.00444679 | 18.8061 | 03210062 | -0.508338 | 0.508338 | 19.1577 |
| 3 | 03210056 | -0.00918377 | 0.00918377 | 18.7406 | 03210054 | -0.511262 | 0.511262 | 18.9499 |
| 4 | 03210060 | -0.00669853 | 0.00669853 | 18.6165 | 03210055 | -0.511274 | 0.511274 | 18.5909 |