| Red | Green | Blue | |
| z | 17.64 | ||
| znorm | Inf | ||
| sky | -NaN | -Inf | -Inf |
| S/N | 29.6 | 50.0 | 54.4 |
| S/N(c) | 0.0 | 0.0 | 0.0 |
| SN(E/C) |
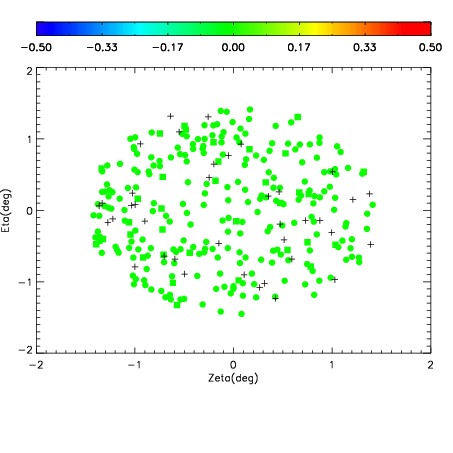
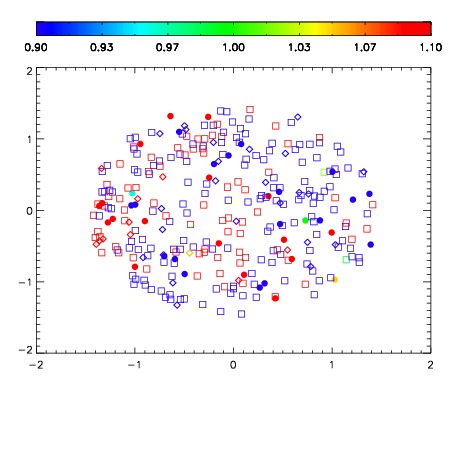
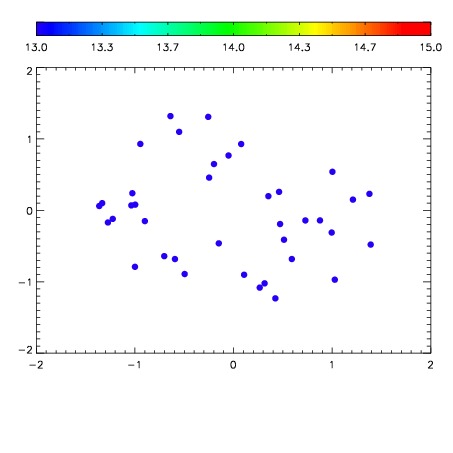

| Frame | Nreads | Zeropoints | Mag plots | Spatial mag deviation | Spatial sky 16325A emission deviations (filled: sky, open: star) | Spatial sky continuum emission | Spatial sky telluric CO2 absorption deviations (filled: H < 10) | |||||||||||||||||||||||
| 0 | 0 |
|
|
|
|
|
|
| IPAIR | NAME | SHIFT | NEWSHIFT | S/N | NAME | SHIFT | NEWSHIFT | S/N |
| 0 | 03720062 | 0.506882 | 0.00000 | 19.2215 | 03720060 | 0.00000 | 0.506882 | 19.2184 |
| 1 | 03720065 | 0.501302 | 0.00558001 | 19.2352 | 03720067 | 0.00134563 | 0.505536 | 19.2368 |
| 2 | 03720061 | 0.505891 | 0.000990987 | 19.2230 | 03720064 | 0.000256396 | 0.506626 | 19.2268 |
| 3 | 03720066 | 0.505110 | 0.00177199 | 19.1935 | 03720063 | 0.00194210 | 0.504940 | 19.2149 |