| Red | Green | Blue | |
| z | 17.64 | ||
| znorm | Inf | ||
| sky | -Inf | -Inf | -Inf |
| S/N | 25.0 | 41.9 | 45.3 |
| S/N(c) | 0.0 | 0.0 | 0.0 |
| SN(E/C) |
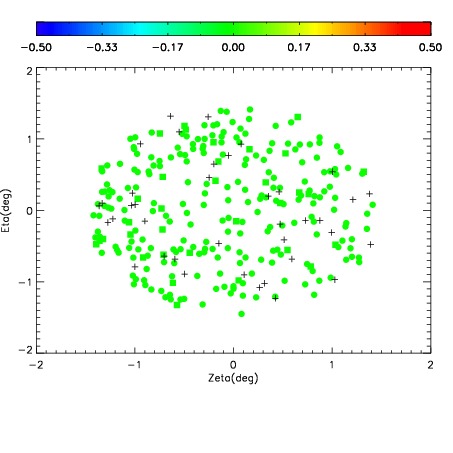
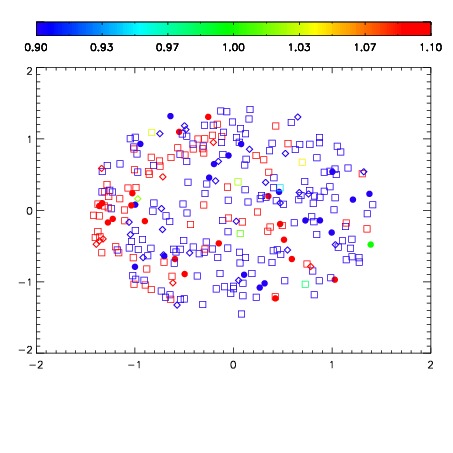
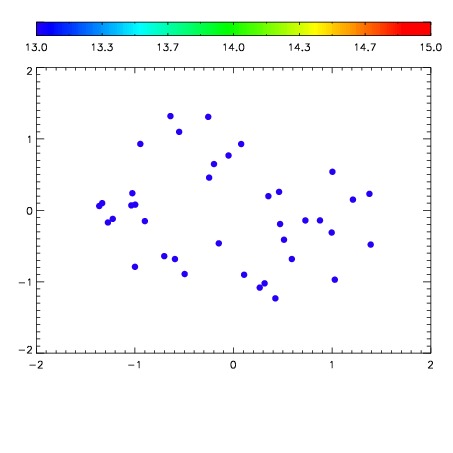

| Frame | Nreads | Zeropoints | Mag plots | Spatial mag deviation | Spatial sky 16325A emission deviations (filled: sky, open: star) | Spatial sky continuum emission | Spatial sky telluric CO2 absorption deviations (filled: H < 10) | |||||||||||||||||||||||
| 0 | 0 |
|
|
|
|
|
|
| IPAIR | NAME | SHIFT | NEWSHIFT | S/N | NAME | SHIFT | NEWSHIFT | S/N |
| 0 | 03980036 | 0.496066 | 0.00000 | 18.9425 | 03980037 | 0.000310023 | 0.495756 | 18.9767 |
| 1 | 03980039 | 0.494303 | 0.00176302 | 18.9628 | 03980038 | -0.000237842 | 0.496304 | 19.0113 |
| 2 | 03980040 | 0.495007 | 0.00105900 | 18.9231 | 03980041 | 0.00321790 | 0.492848 | 18.9462 |
| 3 | 03980035 | 0.495908 | 0.000158012 | 18.8834 | 03980034 | 0.00000 | 0.496066 | 18.7512 |