| Red | Green | Blue | |
| z | 17.64 | ||
| znorm | Inf | ||
| sky | -NaN | -NaN | -Inf |
| S/N | 32.2 | 53.2 | 59.1 |
| S/N(c) | 0.0 | 0.0 | 0.0 |
| SN(E/C) |
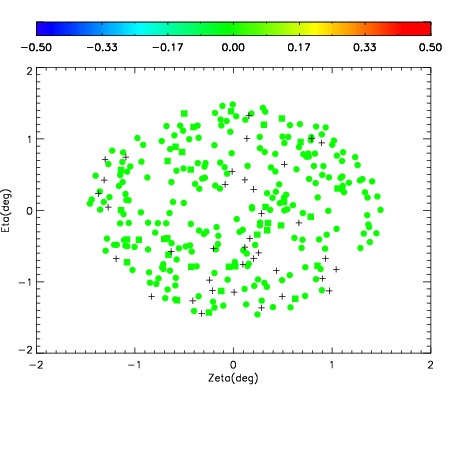
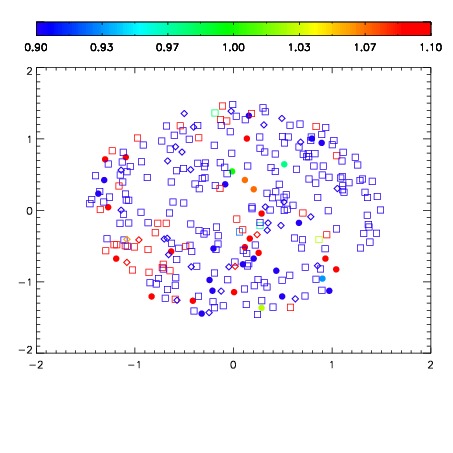
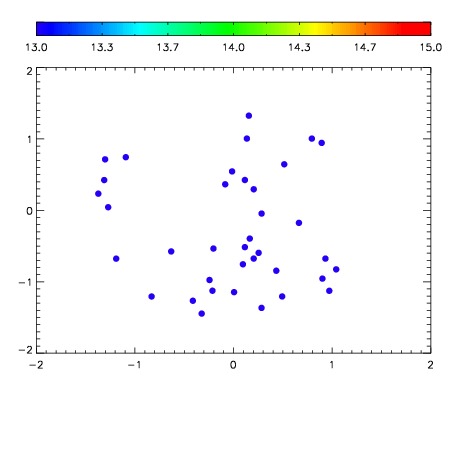

| Frame | Nreads | Zeropoints | Mag plots | Spatial mag deviation | Spatial sky 16325A emission deviations (filled: sky, open: star) | Spatial sky continuum emission | Spatial sky telluric CO2 absorption deviations (filled: H < 10) | |||||||||||||||||||||||
| 0 | 0 |
|
|
|
|
|
|
| IPAIR | NAME | SHIFT | NEWSHIFT | S/N | NAME | SHIFT | NEWSHIFT | S/N |
| 0 | 02870107 | 0.414532 | 0.00000 | 19.0867 | 02870097 | 0.00000 | 0.414532 | 19.0449 |
| 1 | 02870103 | 0.412733 | 0.00179902 | 19.1487 | 02870105 | 0.00176853 | 0.412763 | 19.0993 |
| 2 | 02870102 | 0.411651 | 0.00288102 | 19.1240 | 02870104 | 0.00497082 | 0.409561 | 19.0981 |
| 3 | 02870099 | 0.411148 | 0.00338399 | 19.1157 | 02870101 | 0.00107782 | 0.413454 | 19.0907 |
| 4 | 02870098 | 0.408086 | 0.00644600 | 19.1081 | 02870100 | 0.00285349 | 0.411679 | 19.0898 |
| 5 | 02870106 | 0.414313 | 0.000219017 | 19.0948 | 02870108 | 0.00789269 | 0.406639 | 19.0798 |