| Red | Green | Blue | |
| z | 17.64 | ||
| znorm | Inf | ||
| sky | -NaN | -NaN | -Inf |
| S/N | 3.9 | 6.7 | 7.6 |
| S/N(c) | 0.0 | 0.0 | 0.0 |
| SN(E/C) |
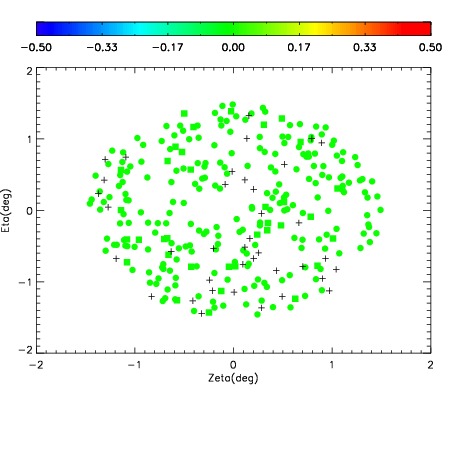
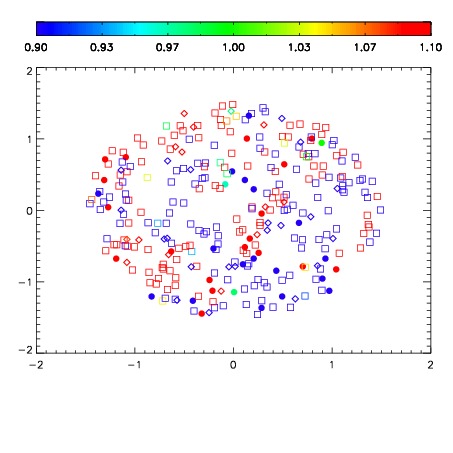
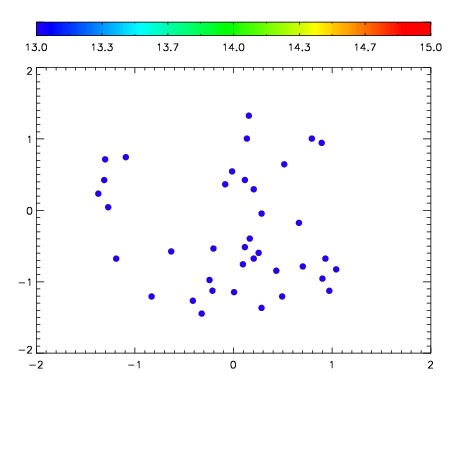

| Frame | Nreads | Zeropoints | Mag plots | Spatial mag deviation | Spatial sky 16325A emission deviations (filled: sky, open: star) | Spatial sky continuum emission | Spatial sky telluric CO2 absorption deviations (filled: H < 10) | |||||||||||||||||||||||
| 0 | 0 |
|
|
|
|
|
|
| IPAIR | NAME | SHIFT | NEWSHIFT | S/N | NAME | SHIFT | NEWSHIFT | S/N |
| 0 | 03990037 | 0.501854 | 0.00000 | 16.5828 | 03990034 | 0.00339690 | 0.498457 | 15.8833 |
| 1 | 03990032 | 0.498894 | 0.00296000 | 17.4379 | 03990031 | 0.00000 | 0.501854 | 17.3734 |
| 2 | 03990033 | 0.499460 | 0.00239399 | 16.6597 | 03990035 | 0.00272522 | 0.499129 | 16.1010 |
| 3 | 03990036 | 0.501515 | 0.000339031 | 15.7608 | 03990038 | 0.00338826 | 0.498466 | 15.7732 |