| Red | Green | Blue | |
| z | 17.64 | ||
| znorm | Inf | ||
| sky | -NaN | -NaN | -Inf |
| S/N | 26.9 | 45.7 | 47.2 |
| S/N(c) | 0.0 | 0.0 | 0.0 |
| SN(E/C) |
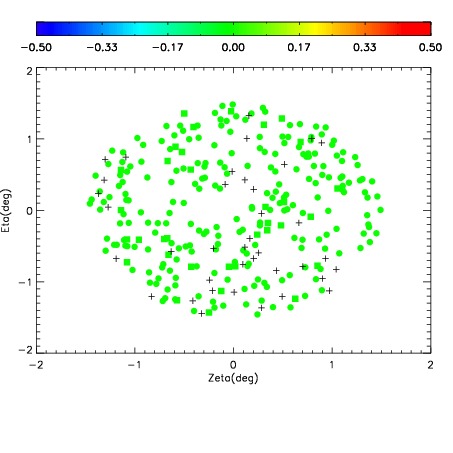
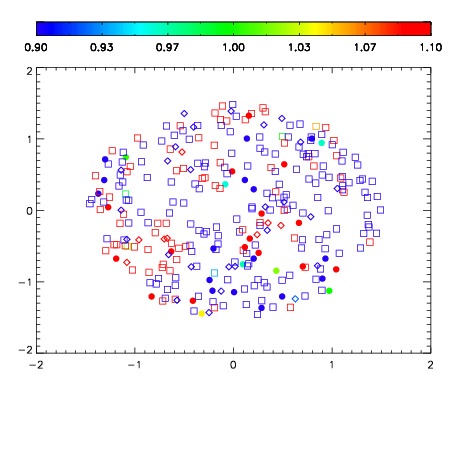
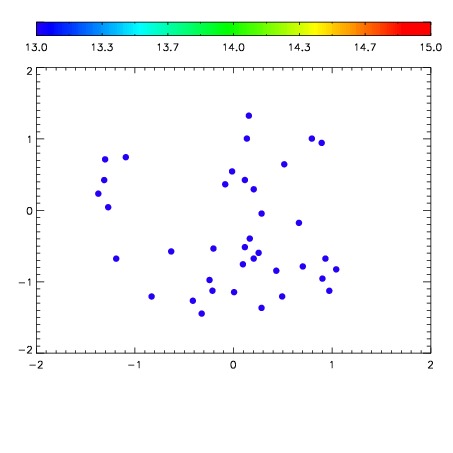

| Frame | Nreads | Zeropoints | Mag plots | Spatial mag deviation | Spatial sky 16325A emission deviations (filled: sky, open: star) | Spatial sky continuum emission | Spatial sky telluric CO2 absorption deviations (filled: H < 10) | |||||||||||||||||||||||
| 0 | 0 |
|
|
|
|
|
|
| IPAIR | NAME | SHIFT | NEWSHIFT | S/N | NAME | SHIFT | NEWSHIFT | S/N |
| 0 | 04040027 | 0.494847 | 0.00000 | 19.0012 | 04040028 | 0.00110022 | 0.493747 | 19.0597 |
| 1 | 04040031 | 0.493855 | 0.000992000 | 19.2126 | 04040032 | -0.000433767 | 0.495281 | 19.2630 |
| 2 | 04040030 | 0.493258 | 0.00158900 | 19.1792 | 04040029 | -0.000831666 | 0.495679 | 19.1084 |
| 3 | 04040026 | 0.494292 | 0.000555009 | 18.9293 | 04040025 | 0.00000 | 0.494847 | 18.9858 |