| Red | Green | Blue | |
| z | 17.64 | ||
| znorm | Inf | ||
| sky | -Inf | -NaN | -NaN |
| S/N | 29.3 | 47.3 | 48.7 |
| S/N(c) | 0.0 | 0.0 | 0.0 |
| SN(E/C) |
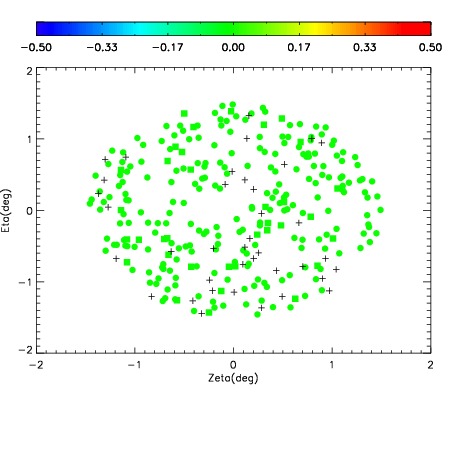
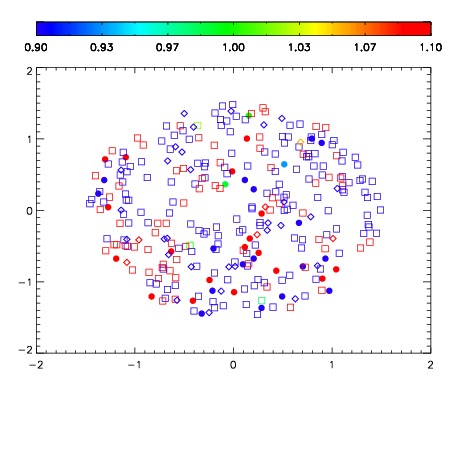


| Frame | Nreads | Zeropoints | Mag plots | Spatial mag deviation | Spatial sky 16325A emission deviations (filled: sky, open: star) | Spatial sky continuum emission | Spatial sky telluric CO2 absorption deviations (filled: H < 10) | |||||||||||||||||||||||
| 0 | 0 |
|
|
|
|
|
|
| IPAIR | NAME | SHIFT | NEWSHIFT | S/N | NAME | SHIFT | NEWSHIFT | S/N |
| 0 | 10300029 | 0.492079 | 0.00000 | 19.1639 | 10300030 | 0.00253195 | 0.489547 | 19.1740 |
| 1 | 10300028 | 0.491871 | 0.000207990 | 19.1934 | 10300031 | 0.00344254 | 0.488636 | 19.1982 |
| 2 | 10300032 | 0.488778 | 0.00330099 | 19.1878 | 10300027 | 0.00000 | 0.492079 | 19.1786 |
| 3 | 10300033 | 0.490029 | 0.00204998 | 19.1593 | 10300034 | 0.00145680 | 0.490622 | 19.1457 |