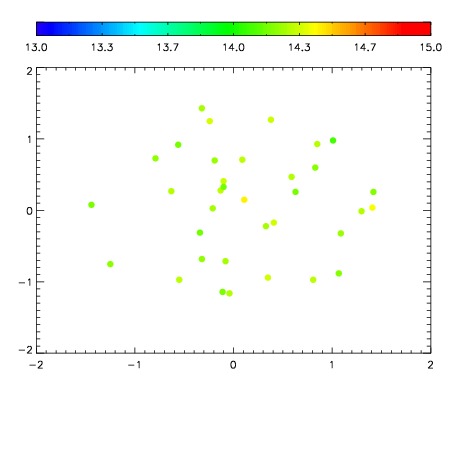
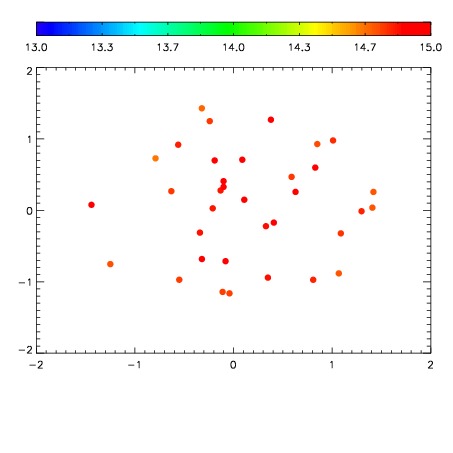
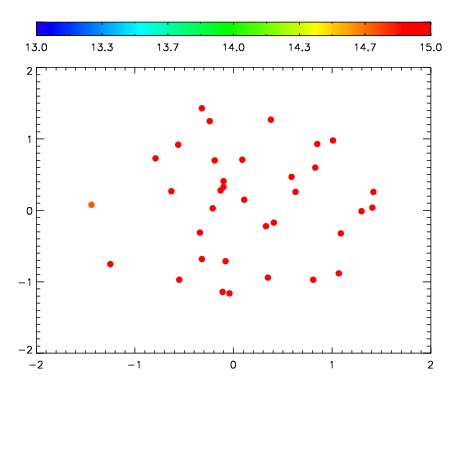
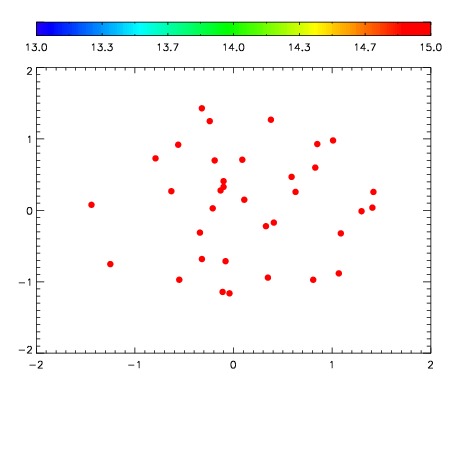
| Frame | Nreads | Zeropoints | Mag plots
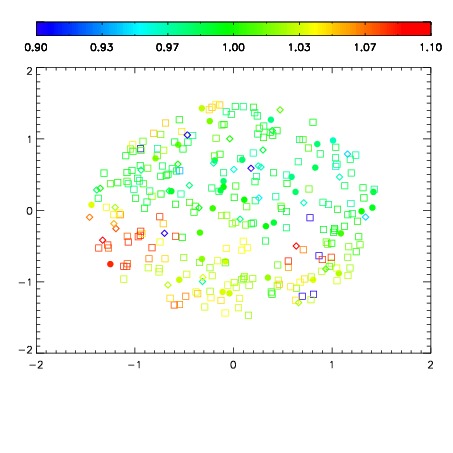
| Spatial mag deviation
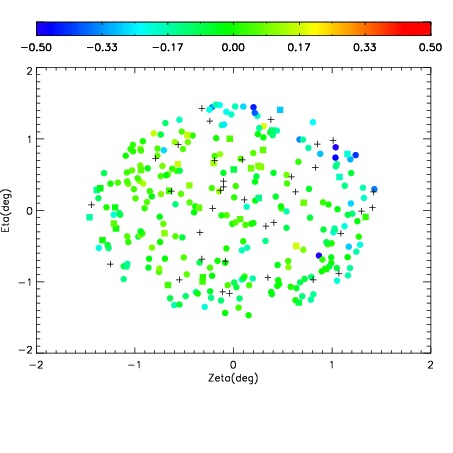
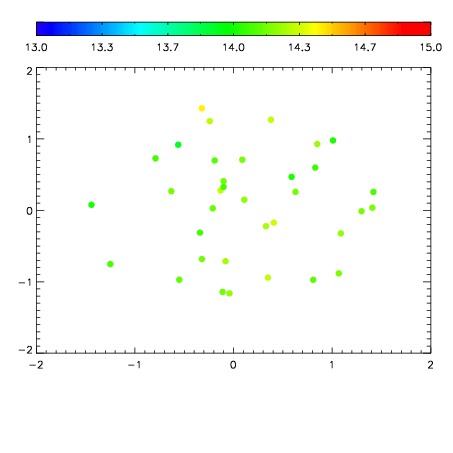
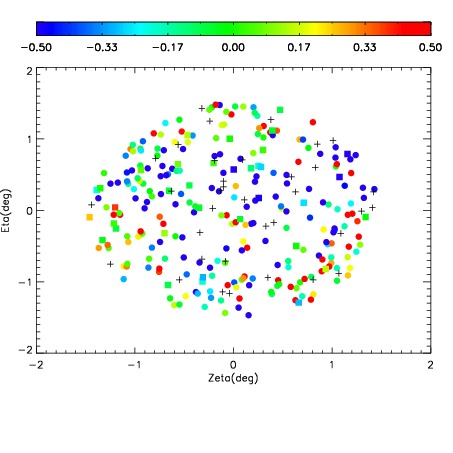
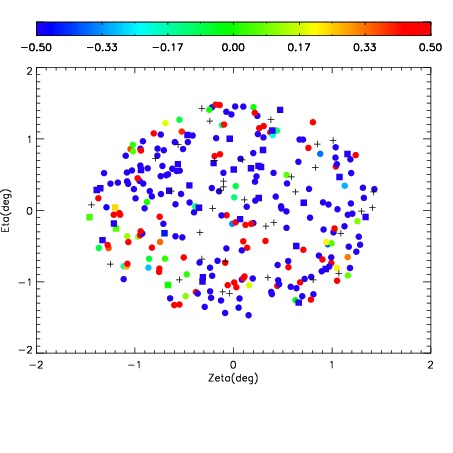
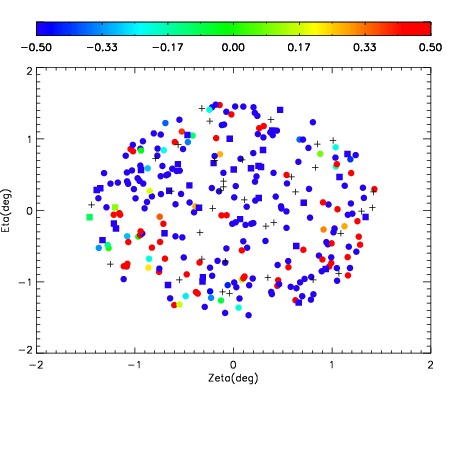
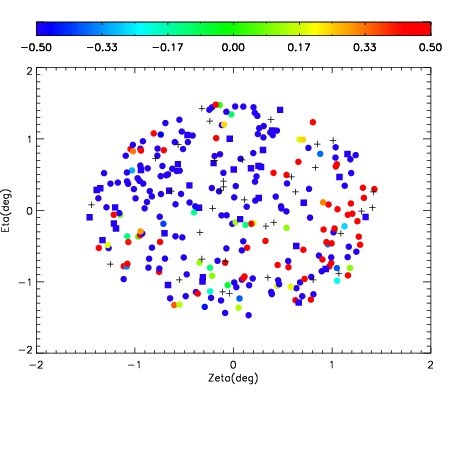
| Spatial sky 16325A emission deviations (filled: sky, open: star)
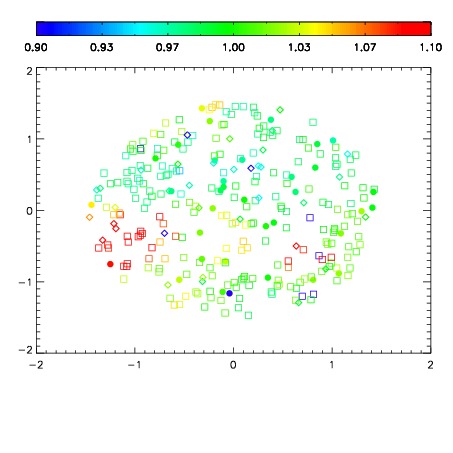
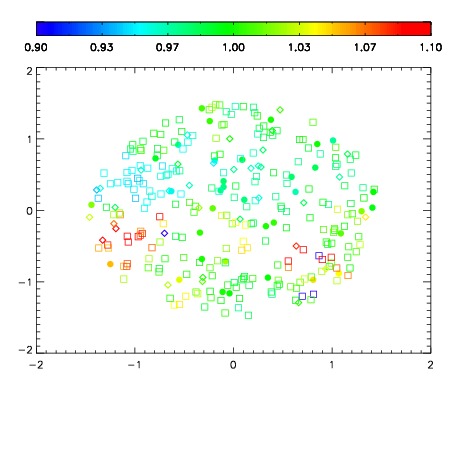
| Spatial sky continuum emission
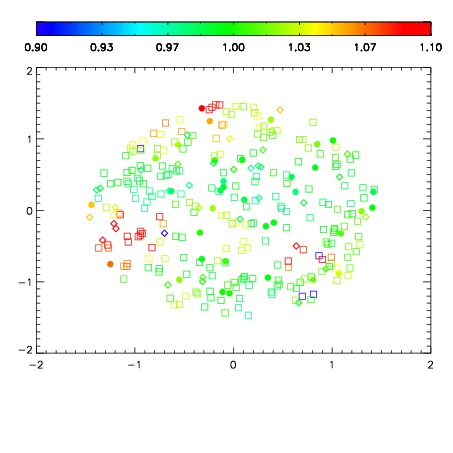
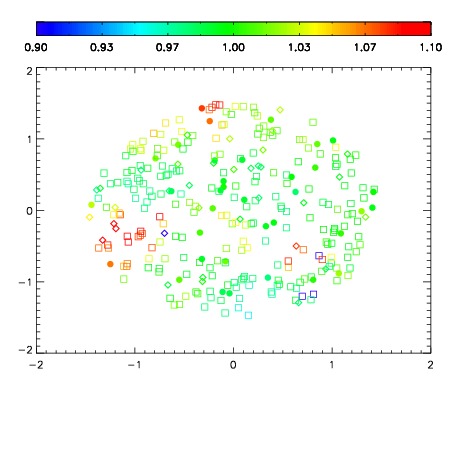
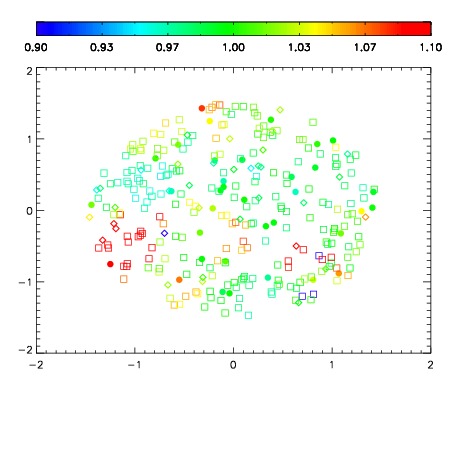
| Spatial sky telluric CO2 absorption deviations (filled: H < 10)
|
| 9960025
| 47
| | Red | Green | Blue
| | z | | 18.36
| | znorm | | 14.18
| | sky | 14.4 | 14.2 | 14.2
| | S/N | 10.6 | 17.3 | 16.2
| | S/N(c) | 10.8 | 18.2 | 10.8
| | SN(E/C) 0.86
|
| 
| 
| 
| 
| 
|
| 9960026
| 47
| | Red | Green | Blue
| | z | | 17.65
| | znorm | | 13.47
| | sky | 14.4 | 14.3 | 14.5
| | S/N | 6.3 | 10.9 | 10.3
| | S/N(c) | 6.7 | 12.0 | 7.4
| | SN(E/C) 0.91
|
| 
| 
| 
| 
| 
|
| 9960027
| 47
| | Red | Green | Blue
| | z | | 14.87
| | znorm | | 10.69
| | sky | 14.8 | 14.8 | 15.4
| | S/N | 0.4 | 1.0 | 0.9
| | S/N(c) | 0.7 | 1.8 | 1.2
| | SN(E/C) 0.99
|
| 
| 
| 
| 
| 
|
| 9960028
| 47
| | Red | Green | Blue
| | z | | 13.52
| | znorm | | 9.34
| | sky | 15.0 | 15.2 | 15.6
| | S/N | -0.0 | 0.2 | 0.0
| | S/N(c) | 0.0 | 0.0 | 0.0
| | SN(E/C) 2.13
|
| 
| 
| 
| 
| 
|
| 9960029
| 47
| | Red | Green | Blue
| | z | | 13.26
| | znorm | | 9.08
| | sky | 15.2 | 15.6 | 16.2
| | S/N | -0.1 | 0.1 | -0.0
| | S/N(c) | 0.0 | 0.0 | 0.0
| | SN(E/C) 3.03
|
| 
| 
| 
| 
| 
|
| 9960030
| 47
| | Red | Green | Blue
| | z | | 13.72
| | znorm | | 9.54
| | sky | 15.3 | 15.4 | 16.7
| | S/N | 0.1 | 0.2 | -0.0
| | S/N(c) | 0.0 | 0.0 | 0.0
| | SN(E/C) 3.90
|
| 
| 
| 
| 
| 
|