| Red | Green | Blue | |
| z | 17.64 | ||
| znorm | Inf | ||
| sky | -NaN | -NaN | -Inf |
| S/N | 28.3 | 42.6 | 38.6 |
| S/N(c) | 0.0 | 0.0 | 0.0 |
| SN(E/C) |
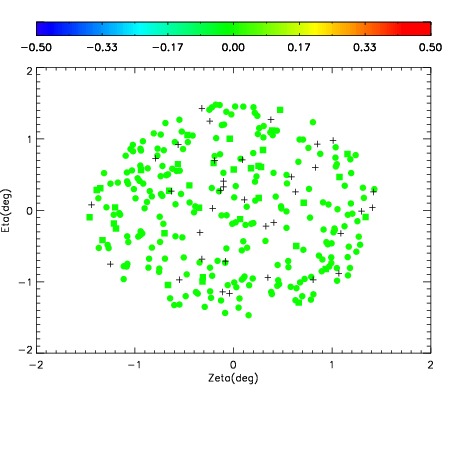
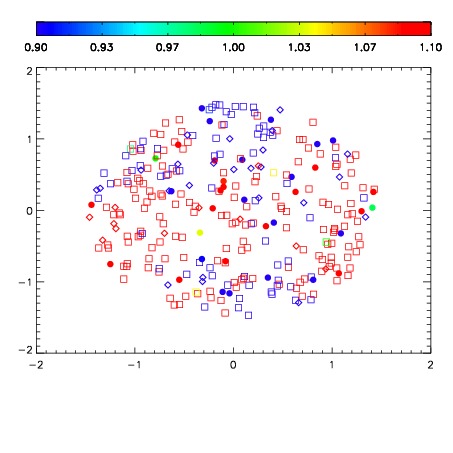
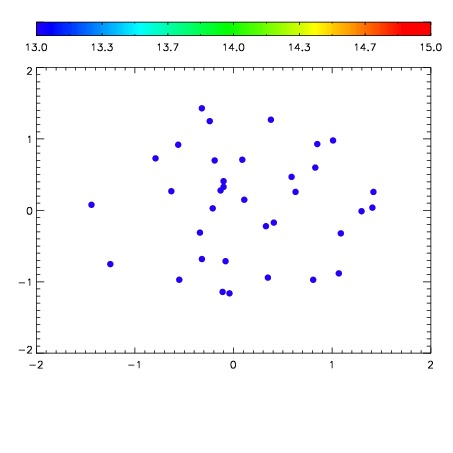

| Frame | Nreads | Zeropoints | Mag plots | Spatial mag deviation | Spatial sky 16325A emission deviations (filled: sky, open: star) | Spatial sky continuum emission | Spatial sky telluric CO2 absorption deviations (filled: H < 10) | |||||||||||||||||||||||
| 0 | 0 |
|
|
|
|
|
|
| IPAIR | NAME | SHIFT | NEWSHIFT | S/N | NAME | SHIFT | NEWSHIFT | S/N |
| 0 | 10220013 | 0.488166 | 0.00000 | 18.8043 | 10220012 | 0.00000 | 0.488166 | 18.8747 |
| 1 | 10220018 | 0.486718 | 0.00144801 | 18.9539 | 10220019 | -0.00202888 | 0.490195 | 19.0007 |
| 2 | 10220017 | 0.486320 | 0.00184602 | 18.9243 | 10220016 | -0.00153709 | 0.489703 | 18.8855 |
| 3 | 10220014 | 0.488072 | 9.39965e-05 | 18.6949 | 10220015 | -0.00120210 | 0.489368 | 18.7881 |