| Red | Green | Blue | |
| z | 17.64 | ||
| znorm | Inf | ||
| sky | -Inf | -Inf | -Inf |
| S/N | 30.2 | 46.7 | 44.4 |
| S/N(c) | 0.0 | 0.0 | 0.0 |
| SN(E/C) |

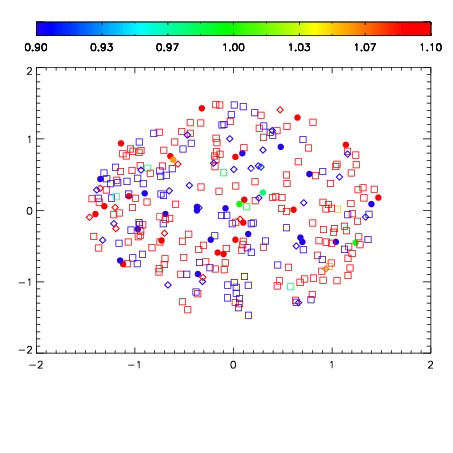


| Frame | Nreads | Zeropoints | Mag plots | Spatial mag deviation | Spatial sky 16325A emission deviations (filled: sky, open: star) | Spatial sky continuum emission | Spatial sky telluric CO2 absorption deviations (filled: H < 10) | |||||||||||||||||||||||
| 0 | 0 |
|
|
|
|
|
|
| IPAIR | NAME | SHIFT | NEWSHIFT | S/N | NAME | SHIFT | NEWSHIFT | S/N |
| 0 | 10200012 | 0.496339 | 0.00000 | 19.0573 | 10200011 | 0.00000 | 0.496339 | 18.9917 |
| 1 | 10200017 | 0.495777 | 0.000561982 | 19.1372 | 10200018 | -0.00160932 | 0.497948 | 19.1352 |
| 2 | 10200013 | 0.496104 | 0.000234991 | 19.0693 | 10200015 | -0.000206228 | 0.496545 | 19.1301 |
| 3 | 10200016 | 0.495170 | 0.00116900 | 19.0601 | 10200014 | 0.000479797 | 0.495859 | 19.1132 |