| Red | Green | Blue | |
| z | 17.64 | ||
| znorm | Inf | ||
| sky | -NaN | -Inf | -Inf |
| S/N | 27.9 | 44.1 | 43.3 |
| S/N(c) | 0.0 | 0.0 | 0.0 |
| SN(E/C) |
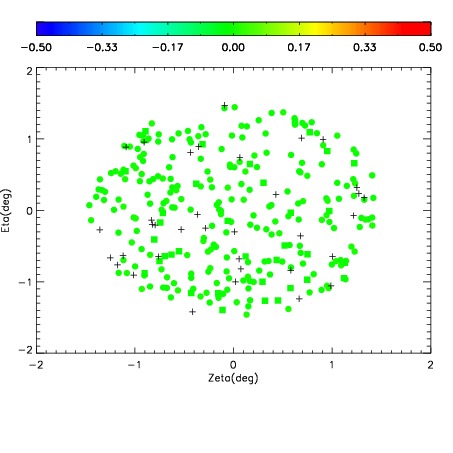
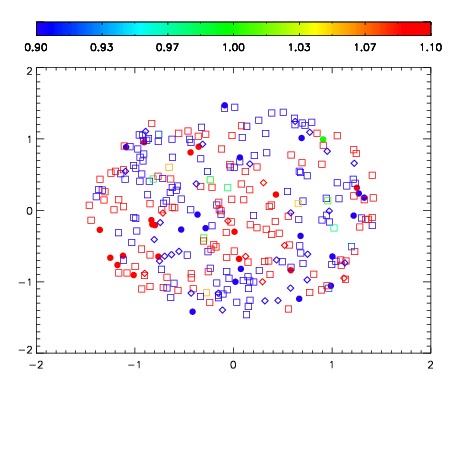
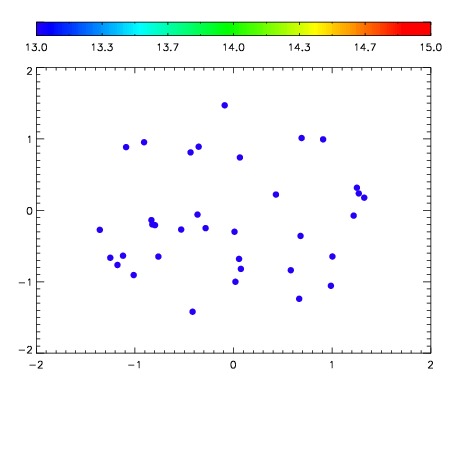

| Frame | Nreads | Zeropoints | Mag plots | Spatial mag deviation | Spatial sky 16325A emission deviations (filled: sky, open: star) | Spatial sky continuum emission | Spatial sky telluric CO2 absorption deviations (filled: H < 10) | |||||||||||||||||||||||
| 0 | 0 |
|
|
|
|
|
|
| IPAIR | NAME | SHIFT | NEWSHIFT | S/N | NAME | SHIFT | NEWSHIFT | S/N |
| 0 | 09050053 | 0.484897 | 0.00000 | 19.0808 | 09050054 | 0.00367979 | 0.481217 | 19.0765 |
| 1 | 09050048 | 0.480482 | 0.00441498 | 19.0577 | 09050051 | 0.00284276 | 0.482054 | 19.0666 |
| 2 | 09050049 | 0.479991 | 0.00490600 | 19.0550 | 09050047 | 0.00000 | 0.484897 | 19.0442 |
| 3 | 09050052 | 0.484731 | 0.000165999 | 19.0247 | 09050050 | 0.00311707 | 0.481780 | 19.0435 |