| Red | Green | Blue | |
| z | 17.64 | ||
| znorm | Inf | ||
| sky | -NaN | -Inf | -NaN |
| S/N | 30.7 | 50.6 | 51.1 |
| S/N(c) | 0.0 | 0.0 | 0.0 |
| SN(E/C) |
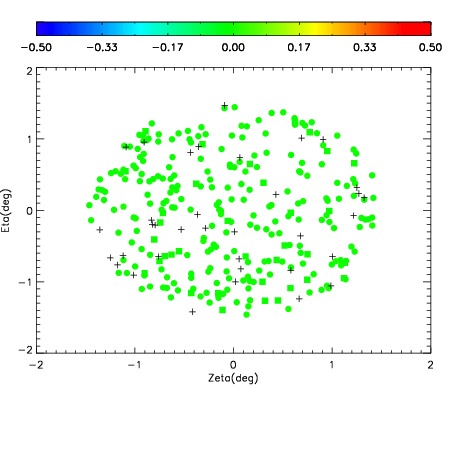
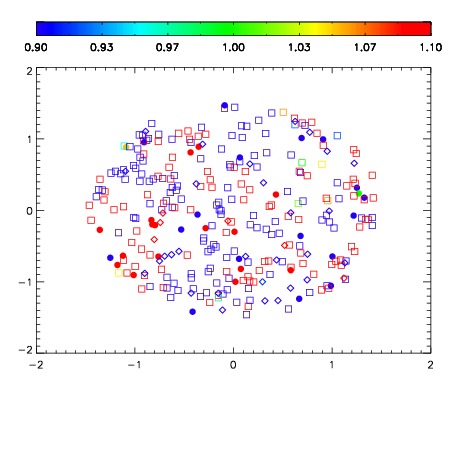


| Frame | Nreads | Zeropoints | Mag plots | Spatial mag deviation | Spatial sky 16325A emission deviations (filled: sky, open: star) | Spatial sky continuum emission | Spatial sky telluric CO2 absorption deviations (filled: H < 10) | |||||||||||||||||||||||
| 0 | 0 |
|
|
|
|
|
|
| IPAIR | NAME | SHIFT | NEWSHIFT | S/N | NAME | SHIFT | NEWSHIFT | S/N |
| 0 | 09950016 | 0.524203 | 0.00000 | 19.1837 | 09950019 | 0.000898311 | 0.523305 | 19.1551 |
| 1 | 09950020 | 0.523533 | 0.000670016 | 19.2260 | 09950022 | 0.00275881 | 0.521444 | 19.2133 |
| 2 | 09950021 | 0.523850 | 0.000352979 | 19.2149 | 09950018 | 0.000982135 | 0.523221 | 19.2070 |
| 3 | 09950017 | 0.524172 | 3.09944e-05 | 19.1987 | 09950015 | 0.00000 | 0.524203 | 19.1674 |