| Red | Green | Blue | |
| z | 17.64 | ||
| znorm | Inf | ||
| sky | -Inf | -Inf | -Inf |
| S/N | 29.5 | 47.9 | 49.5 |
| S/N(c) | 0.0 | 0.0 | 0.0 |
| SN(E/C) |
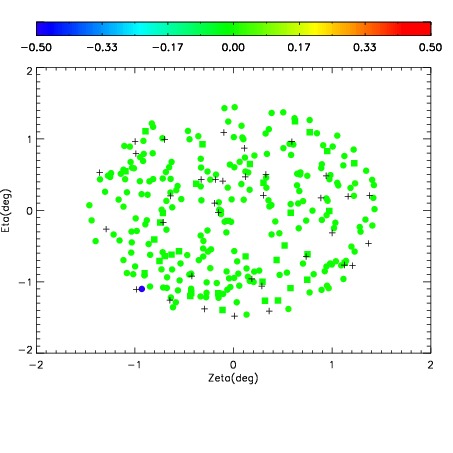
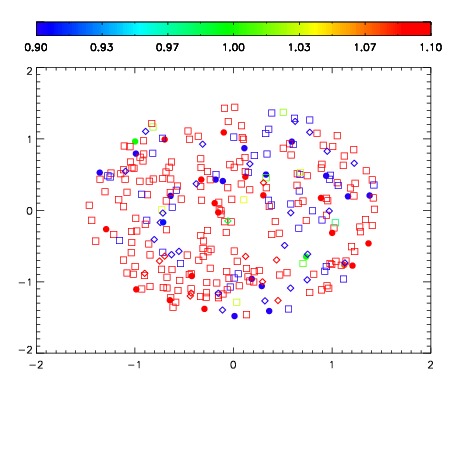
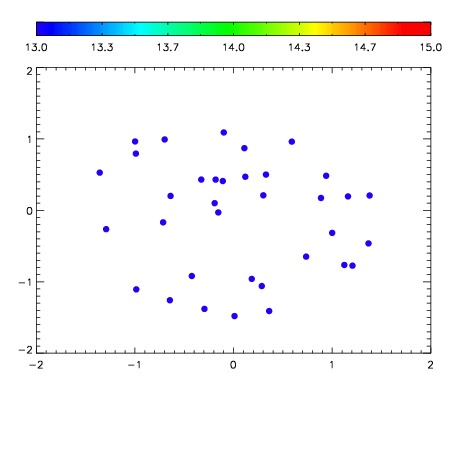

| Frame | Nreads | Zeropoints | Mag plots | Spatial mag deviation | Spatial sky 16325A emission deviations (filled: sky, open: star) | Spatial sky continuum emission | Spatial sky telluric CO2 absorption deviations (filled: H < 10) | |||||||||||||||||||||||
| 0 | 0 |
|
|
|
|
|
|
| IPAIR | NAME | SHIFT | NEWSHIFT | S/N | NAME | SHIFT | NEWSHIFT | S/N |
| 0 | 10150028 | 0.493235 | 0.00000 | 19.1491 | 10150033 | 0.00294667 | 0.490288 | 19.1484 |
| 1 | 10150031 | 0.491292 | 0.00194299 | 19.1774 | 10150030 | -0.00140012 | 0.494635 | 19.1665 |
| 2 | 10150032 | 0.491938 | 0.00129700 | 19.1265 | 10150029 | -0.00103603 | 0.494271 | 19.1392 |
| 3 | 10150027 | 0.492368 | 0.000866979 | 19.1043 | 10150026 | 0.00000 | 0.493235 | 19.0996 |