| Red | Green | Blue | |
| z | 17.64 | ||
| znorm | Inf | ||
| sky | -Inf | -Inf | -Inf |
| S/N | 18.3 | 31.9 | 34.0 |
| S/N(c) | 0.0 | 0.0 | 0.0 |
| SN(E/C) |
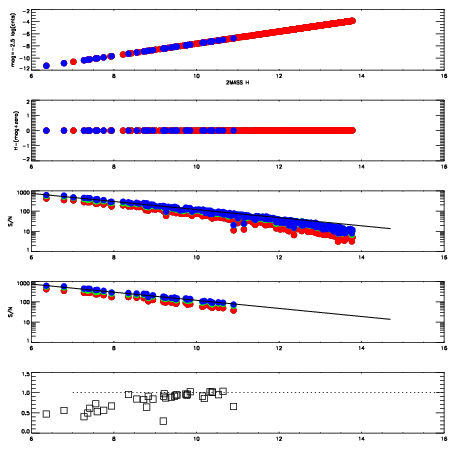
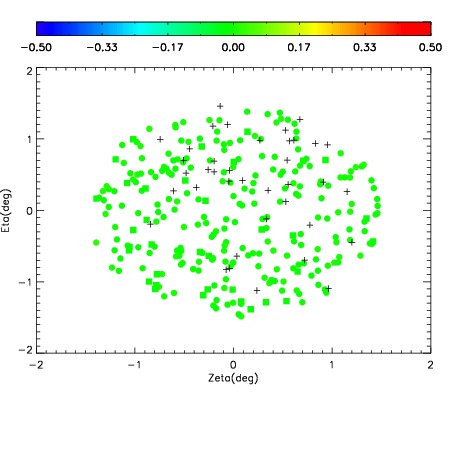
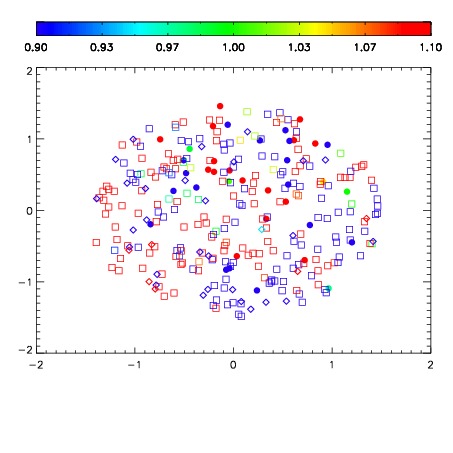
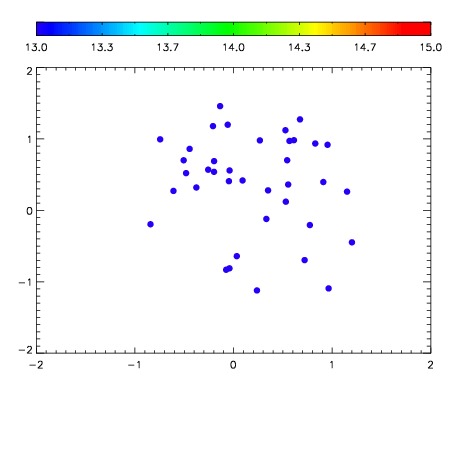

| Frame | Nreads | Zeropoints | Mag plots | Spatial mag deviation | Spatial sky 16325A emission deviations (filled: sky, open: star) | Spatial sky continuum emission | Spatial sky telluric CO2 absorption deviations (filled: H < 10) | |||||||||||||||||||||||
| 0 | 0 |
|
|
|
|
|
|
| IPAIR | NAME | SHIFT | NEWSHIFT | S/N | NAME | SHIFT | NEWSHIFT | S/N |
| 0 | 09100050 | 0.478843 | 0.00000 | 18.8276 | 09100051 | -0.000871557 | 0.479715 | 18.9742 |
| 1 | 09100045 | 0.476347 | 0.00249600 | 18.6879 | 09100044 | 0.00000 | 0.478843 | 18.6730 |
| 2 | 09100049 | 0.477495 | 0.00134799 | 18.3460 | 09100047 | 0.00242190 | 0.476421 | 18.1285 |
| 3 | 09100046 | 0.476735 | 0.00210801 | 17.8359 | 09100048 | 0.00200748 | 0.476836 | 18.0564 |