| Red | Green | Blue | |
| z | 17.64 | ||
| znorm | Inf | ||
| sky | -Inf | -Inf | -Inf |
| S/N | 33.1 | 55.3 | 58.1 |
| S/N(c) | 0.0 | 0.0 | 0.0 |
| SN(E/C) |


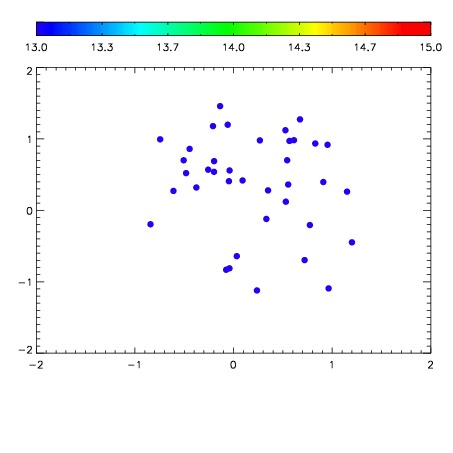

| Frame | Nreads | Zeropoints | Mag plots | Spatial mag deviation | Spatial sky 16325A emission deviations (filled: sky, open: star) | Spatial sky continuum emission | Spatial sky telluric CO2 absorption deviations (filled: H < 10) | |||||||||||||||||||||||
| 0 | 0 |
|
|
|
|
|
|
| IPAIR | NAME | SHIFT | NEWSHIFT | S/N | NAME | SHIFT | NEWSHIFT | S/N |
| 0 | 09950039 | 0.524573 | 0.00000 | 19.2410 | 09950040 | 0.00364059 | 0.520932 | 19.2371 |
| 1 | 09950038 | 0.524246 | 0.000327051 | 19.2454 | 09950037 | 0.00000 | 0.524573 | 19.2388 |
| 2 | 09950042 | 0.523268 | 0.00130504 | 19.2309 | 09950041 | 0.00383179 | 0.520741 | 19.2323 |
| 3 | 09950043 | 0.522968 | 0.00160503 | 19.2252 | 09950044 | 0.00163028 | 0.522943 | 19.2227 |