| Red | Green | Blue | |
| z | 17.64 | ||
| znorm | Inf | ||
| sky | -Inf | -NaN | -Inf |
| S/N | 30.8 | 51.7 | 53.1 |
| S/N(c) | 0.0 | 0.0 | 0.0 |
| SN(E/C) |
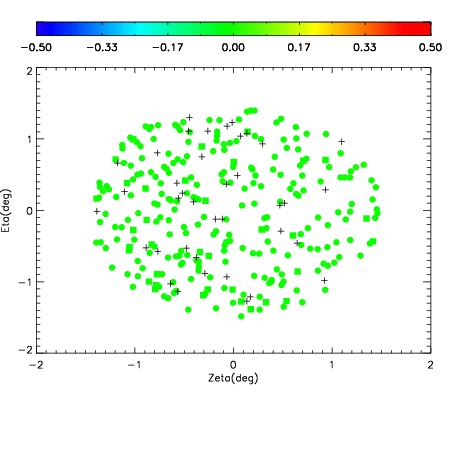
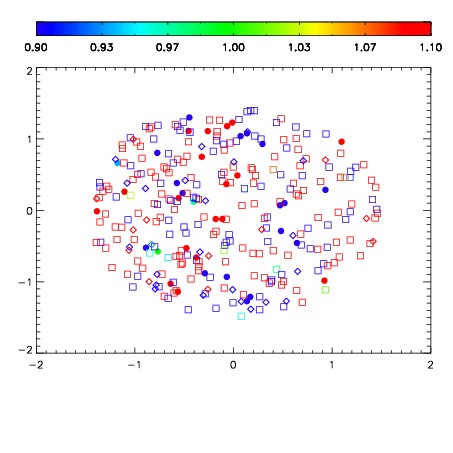


| Frame | Nreads | Zeropoints | Mag plots | Spatial mag deviation | Spatial sky 16325A emission deviations (filled: sky, open: star) | Spatial sky continuum emission | Spatial sky telluric CO2 absorption deviations (filled: H < 10) | |||||||||||||||||||||||
| 0 | 0 |
|
|
|
|
|
|
| IPAIR | NAME | SHIFT | NEWSHIFT | S/N | NAME | SHIFT | NEWSHIFT | S/N |
| 0 | 03050025 | 0.501536 | 0.00000 | 19.1402 | 03050024 | 0.00000 | 0.501536 | 19.1566 |
| 1 | 03050026 | 0.501416 | 0.000119984 | 19.1387 | 03050028 | -0.000336568 | 0.501873 | 19.1357 |
| 2 | 03050030 | 0.498861 | 0.00267500 | 19.1348 | 03050027 | 0.00127610 | 0.500260 | 19.1318 |
| 3 | 03050029 | 0.498128 | 0.00340801 | 19.1008 | 03050031 | 0.000300354 | 0.501236 | 19.1238 |