| Red | Green | Blue | |
| z | 17.64 | ||
| znorm | Inf | ||
| sky | -Inf | -Inf | -Inf |
| S/N | 22.3 | 38.8 | 40.9 |
| S/N(c) | 0.0 | 0.0 | 0.0 |
| SN(E/C) |
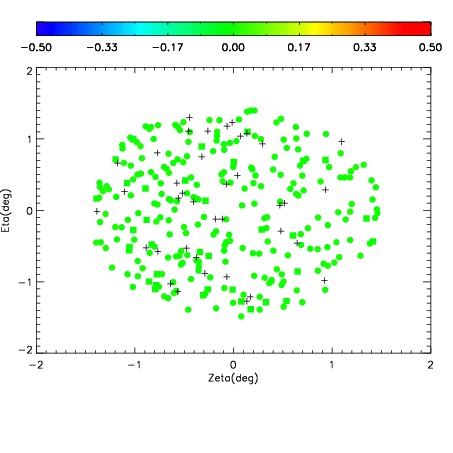
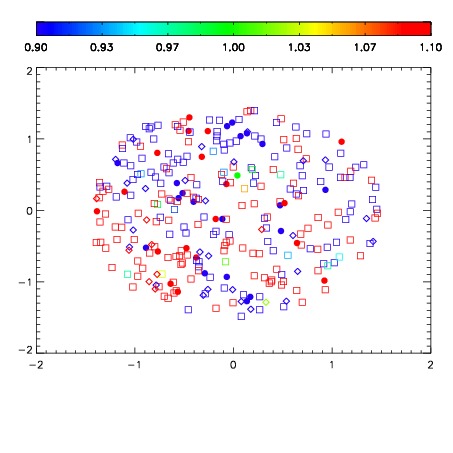
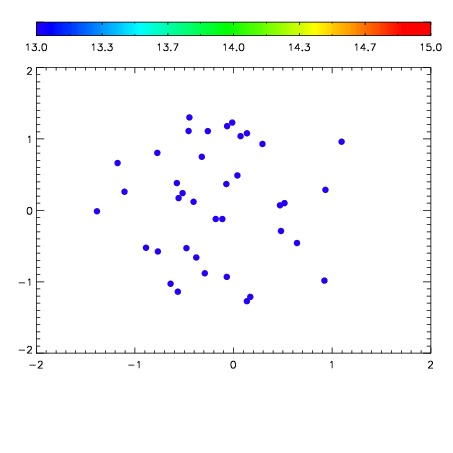

| Frame | Nreads | Zeropoints | Mag plots | Spatial mag deviation | Spatial sky 16325A emission deviations (filled: sky, open: star) | Spatial sky continuum emission | Spatial sky telluric CO2 absorption deviations (filled: H < 10) | |||||||||||||||||||||||
| 0 | 0 |
|
|
|
|
|
|
| IPAIR | NAME | SHIFT | NEWSHIFT | S/N | NAME | SHIFT | NEWSHIFT | S/N |
| 0 | 09150017 | 0.480658 | 0.00000 | 18.1234 | 09150014 | -0.000889914 | 0.481548 | 18.3769 |
| 1 | 09150013 | 0.479104 | 0.00155398 | 18.8742 | 09150011 | 0.00000 | 0.480658 | 18.9008 |
| 2 | 09150012 | 0.479498 | 0.00116000 | 18.6443 | 09150015 | -0.000543797 | 0.481202 | 18.5915 |
| 3 | 09150016 | 0.479515 | 0.00114301 | 18.6198 | 09150019 | 0.000430907 | 0.480227 | 18.5208 |
| 4 | 09150020 | 0.480119 | 0.000539005 | 18.0814 | 09150018 | 0.000502209 | 0.480156 | 17.4648 |