| Red | Green | Blue | |
| z | 17.64 | ||
| znorm | Inf | ||
| sky | -Inf | -NaN | -Inf |
| S/N | 35.4 | 55.3 | 62.1 |
| S/N(c) | 0.0 | 0.0 | 0.0 |
| SN(E/C) |

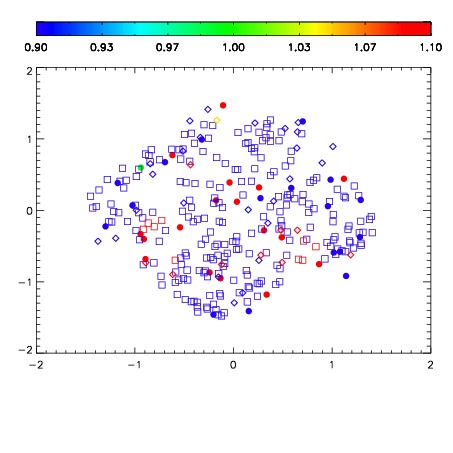


| Frame | Nreads | Zeropoints | Mag plots | Spatial mag deviation | Spatial sky 16325A emission deviations (filled: sky, open: star) | Spatial sky continuum emission | Spatial sky telluric CO2 absorption deviations (filled: H < 10) | |||||||||||||||||||||||
| 0 | 0 |
|
|
|
|
|
|
| IPAIR | NAME | SHIFT | NEWSHIFT | S/N | NAME | SHIFT | NEWSHIFT | S/N |
| 0 | 03140009 | 0.489534 | 0.00000 | 18.9709 | 03140008 | 0.00000 | 0.489534 | 18.9477 |
| 1 | 03140014 | 0.486866 | 0.00266799 | 19.1255 | 03140015 | -0.00197302 | 0.491507 | 19.0755 |
| 2 | 03140013 | 0.483212 | 0.00632200 | 19.0884 | 03140011 | -6.00806e-05 | 0.489594 | 19.0752 |
| 3 | 03140010 | 0.488247 | 0.00128698 | 19.0361 | 03140012 | -0.00207593 | 0.491610 | 19.0517 |