| Red | Green | Blue | |
| z | 17.64 | ||
| znorm | Inf | ||
| sky | -Inf | -Inf | -Inf |
| S/N | 14.7 | 25.6 | 27.7 |
| S/N(c) | 0.0 | 0.0 | 0.0 |
| SN(E/C) |


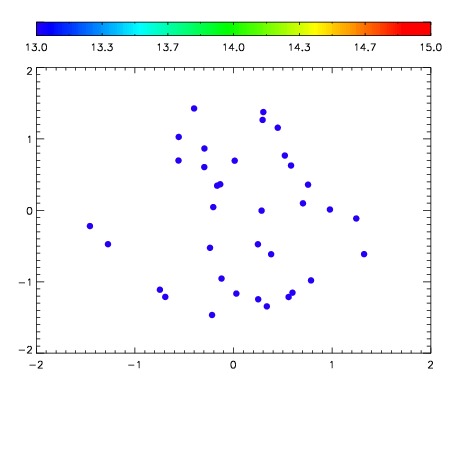

| Frame | Nreads | Zeropoints | Mag plots | Spatial mag deviation | Spatial sky 16325A emission deviations (filled: sky, open: star) | Spatial sky continuum emission | Spatial sky telluric CO2 absorption deviations (filled: H < 10) | |||||||||||||||||||||||
| 0 | 0 |
|
|
|
|
|
|
| IPAIR | NAME | SHIFT | NEWSHIFT | S/N | NAME | SHIFT | NEWSHIFT | S/N |
| 0 | 03090013 | 0.493344 | 0.00000 | 17.3012 | 03090012 | -0.00357650 | 0.496920 | 17.3742 |
| 1 | 03090010 | 0.491582 | 0.00176200 | 18.1792 | 03090015 | -0.00369716 | 0.497041 | 18.3548 |
| 2 | 03090009 | 0.492641 | 0.000703007 | 18.0571 | 03090008 | 0.00000 | 0.493344 | 17.9489 |
| 3 | 03090014 | 0.491614 | 0.00173000 | 18.0036 | 03090011 | -0.00131452 | 0.494659 | 17.9318 |