| Red | Green | Blue | |
| z | 17.64 | ||
| znorm | Inf | ||
| sky | -Inf | -Inf | -Inf |
| S/N | 26.5 | 42.5 | 47.7 |
| S/N(c) | 0.0 | 0.0 | 0.0 |
| SN(E/C) |
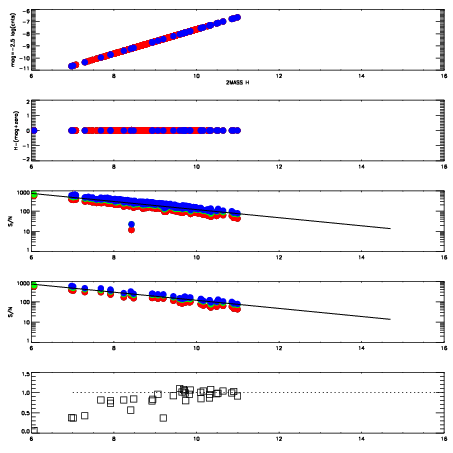
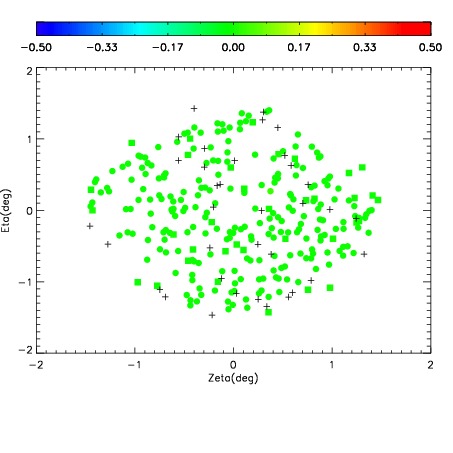
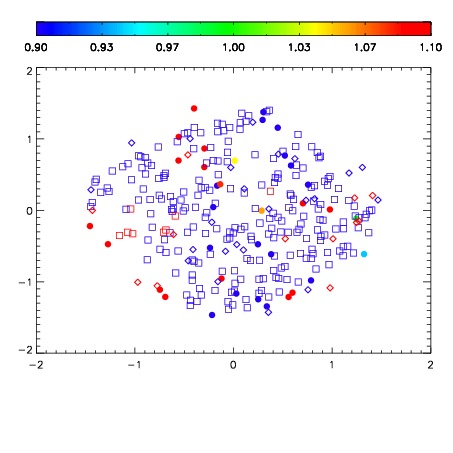


| Frame | Nreads | Zeropoints | Mag plots | Spatial mag deviation | Spatial sky 16325A emission deviations (filled: sky, open: star) | Spatial sky continuum emission | Spatial sky telluric CO2 absorption deviations (filled: H < 10) | |||||||||||||||||||||||
| 0 | 0 |
|
|
|
|
|
|
| IPAIR | NAME | SHIFT | NEWSHIFT | S/N | NAME | SHIFT | NEWSHIFT | S/N |
| 0 | 03100020 | 0.487394 | 0.00000 | 18.8292 | 03100017 | 0.00568158 | 0.481712 | 18.7255 |
| 1 | 03100016 | 0.482397 | 0.00499701 | 18.9818 | 03100021 | 0.000889004 | 0.486505 | 19.0060 |
| 2 | 03100015 | 0.482478 | 0.00491601 | 18.9237 | 03100014 | 0.00000 | 0.487394 | 18.9838 |
| 3 | 03100019 | 0.486886 | 0.000508010 | 18.8592 | 03100018 | 0.00292690 | 0.484467 | 18.8002 |