| Red | Green | Blue | |
| z | 17.64 | ||
| znorm | Inf | ||
| sky | -Inf | -NaN | -Inf |
| S/N | 34.7 | 50.4 | 57.5 |
| S/N(c) | 0.0 | 0.0 | 0.0 |
| SN(E/C) |
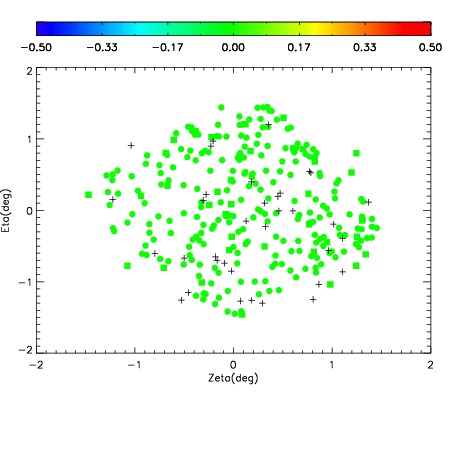
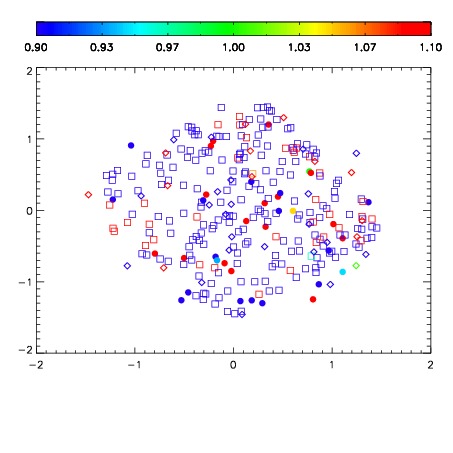
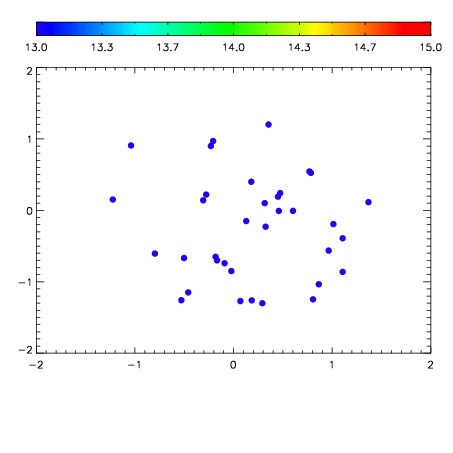

| Frame | Nreads | Zeropoints | Mag plots | Spatial mag deviation | Spatial sky 16325A emission deviations (filled: sky, open: star) | Spatial sky continuum emission | Spatial sky telluric CO2 absorption deviations (filled: H < 10) | |||||||||||||||||||||||
| 0 | 0 |
|
|
|
|
|
|
| IPAIR | NAME | SHIFT | NEWSHIFT | S/N | NAME | SHIFT | NEWSHIFT | S/N |
| 0 | 03120016 | 0.492112 | 0.00000 | 19.1107 | 03120017 | 0.00279160 | 0.489320 | 19.0856 |
| 1 | 03120015 | 0.491197 | 0.000915021 | 19.0713 | 03120014 | 0.00329973 | 0.488812 | 19.0581 |
| 2 | 03120012 | 0.490534 | 0.00157800 | 18.9528 | 03120013 | 0.00361575 | 0.488496 | 19.0223 |
| 3 | 03120011 | 0.488352 | 0.00376001 | 18.9494 | 03120010 | 0.00000 | 0.492112 | 18.9768 |