| Red | Green | Blue | |
| z | 17.64 | ||
| znorm | Inf | ||
| sky | -Inf | -Inf | -NaN |
| S/N | 30.8 | 49.0 | 51.5 |
| S/N(c) | 0.0 | 0.0 | 0.0 |
| SN(E/C) |
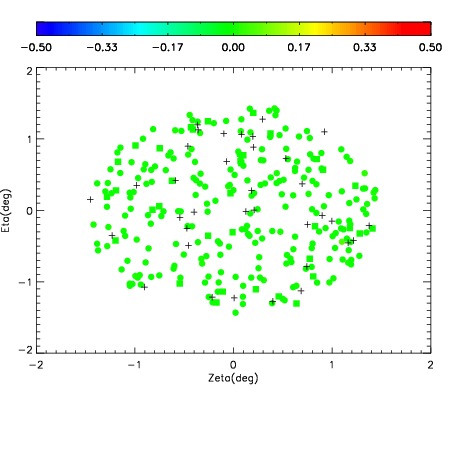
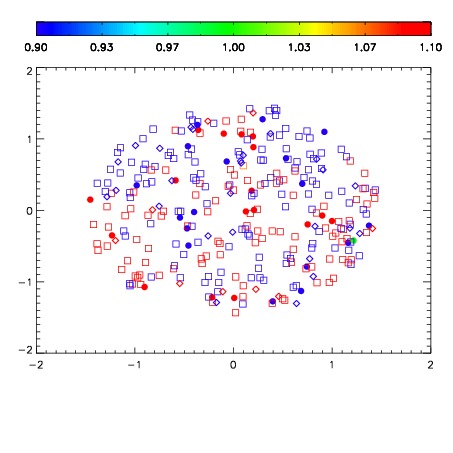
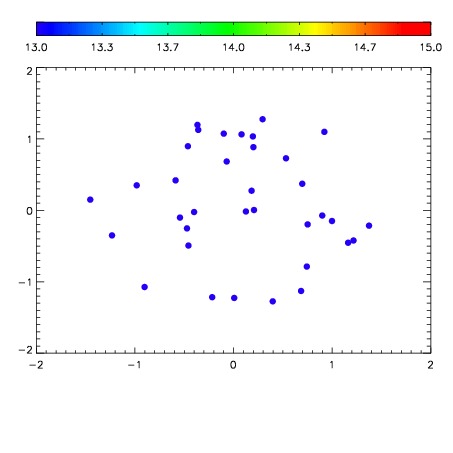

| Frame | Nreads | Zeropoints | Mag plots | Spatial mag deviation | Spatial sky 16325A emission deviations (filled: sky, open: star) | Spatial sky continuum emission | Spatial sky telluric CO2 absorption deviations (filled: H < 10) | |||||||||||||||||||||||
| 0 | 0 |
|
|
|
|
|
|
| IPAIR | NAME | SHIFT | NEWSHIFT | S/N | NAME | SHIFT | NEWSHIFT | S/N |
| 0 | 10200032 | 0.498671 | 0.00000 | 19.1868 | 10200033 | 0.000800763 | 0.497870 | 19.1829 |
| 1 | 10200031 | 0.498234 | 0.000436991 | 19.2101 | 10200030 | 0.00206863 | 0.496602 | 19.2169 |
| 2 | 10200027 | 0.495707 | 0.00296399 | 19.2047 | 10200029 | 0.00177203 | 0.496899 | 19.2016 |
| 3 | 10200028 | 0.495822 | 0.00284898 | 19.1992 | 10200026 | 0.00000 | 0.498671 | 19.1974 |